File list
This special page shows all uploaded files.
| Date | Name | Thumbnail | Size | User | Description | Versions |
|---|---|---|---|---|---|---|
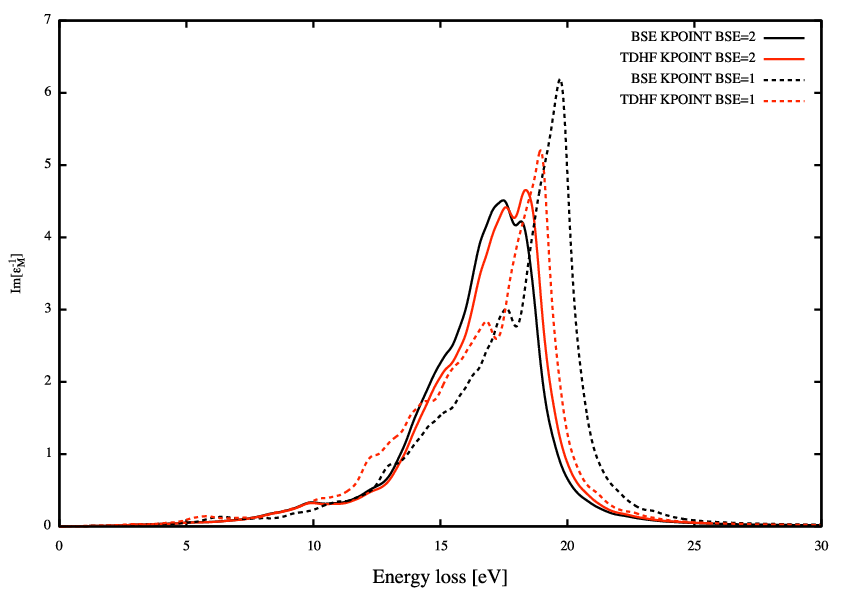
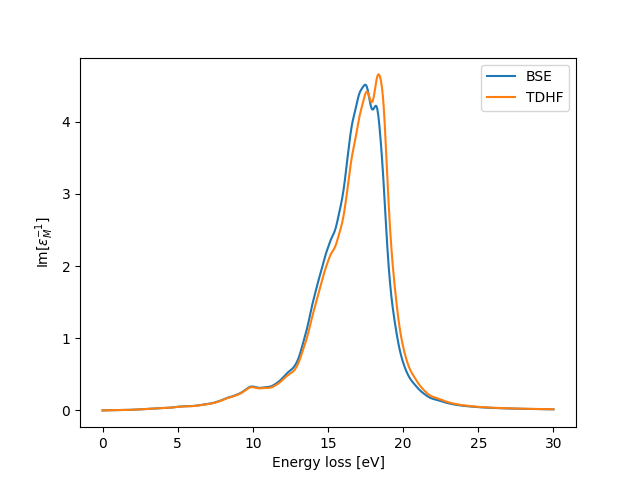
| 14:57, 5 March 2025 | EELS bulk Si BSE TDHF Q2 result.png (file) |  |
42 KB | Pmelo | 3 | |
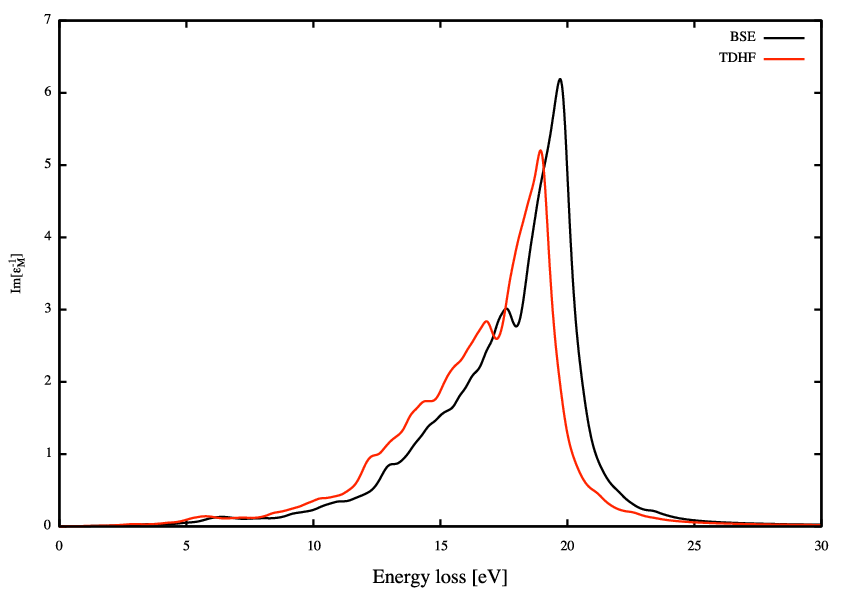
| 14:56, 5 March 2025 | EELS bulk Si BSE TDHF Q1 result.png (file) |  |
13 KB | Pmelo | 3 | |
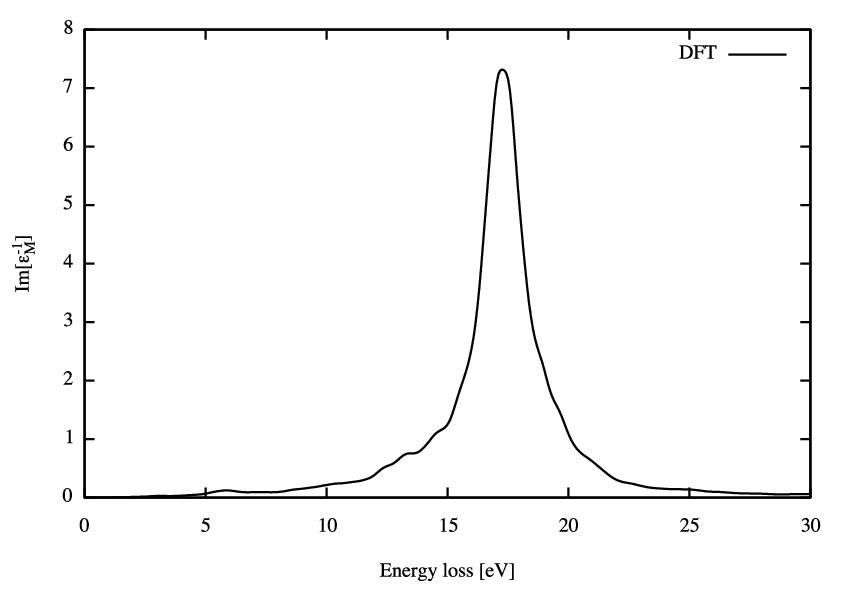
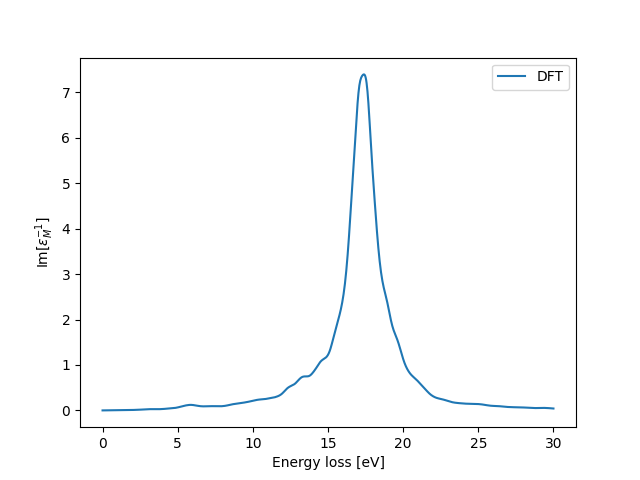
| 14:52, 5 March 2025 | EELS bulk Si DFT result.png (file) |  |
10 KB | Pmelo | 2 | |
| 14:40, 5 March 2025 | EELS bulk Si BSE TDHF Q1 py4vasp.png (file) |  |
24 KB | Pmelo | 2 | |
| 14:37, 5 March 2025 | EELS bulk Si DFT py4vasp.png (file) |  |
18 KB | Pmelo | 2 | |
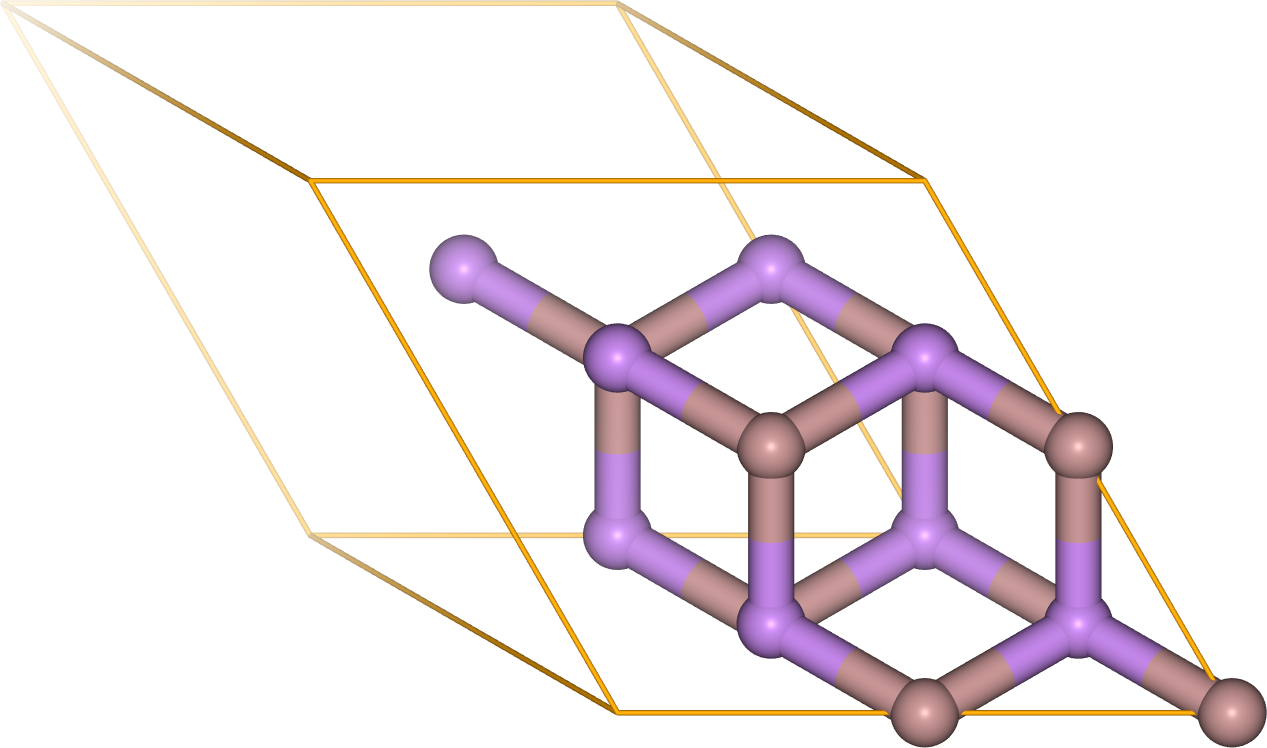
| 15:16, 28 February 2025 | GaAs zincblende py4vasp 2SC.png (file) |  |
247 KB | Wolloch | 2x2x2 Supercell of bulk zincblende GaAs. Created with py4vasp. | 1 |
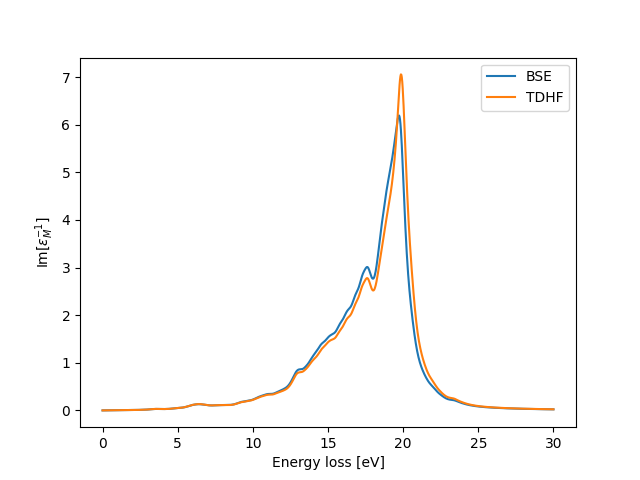
| 12:14, 28 February 2025 | EELS bulk Si BSE TDHF Q2 py4vasp.png (file) |  |
24 KB | Pmelo | 2 | |
| 12:46, 27 February 2025 | Non local dft.png (file) |  |
59 KB | Csheldon | Non-local DFT interaction between pairwise dipole fluctuations in the density. | 1 |
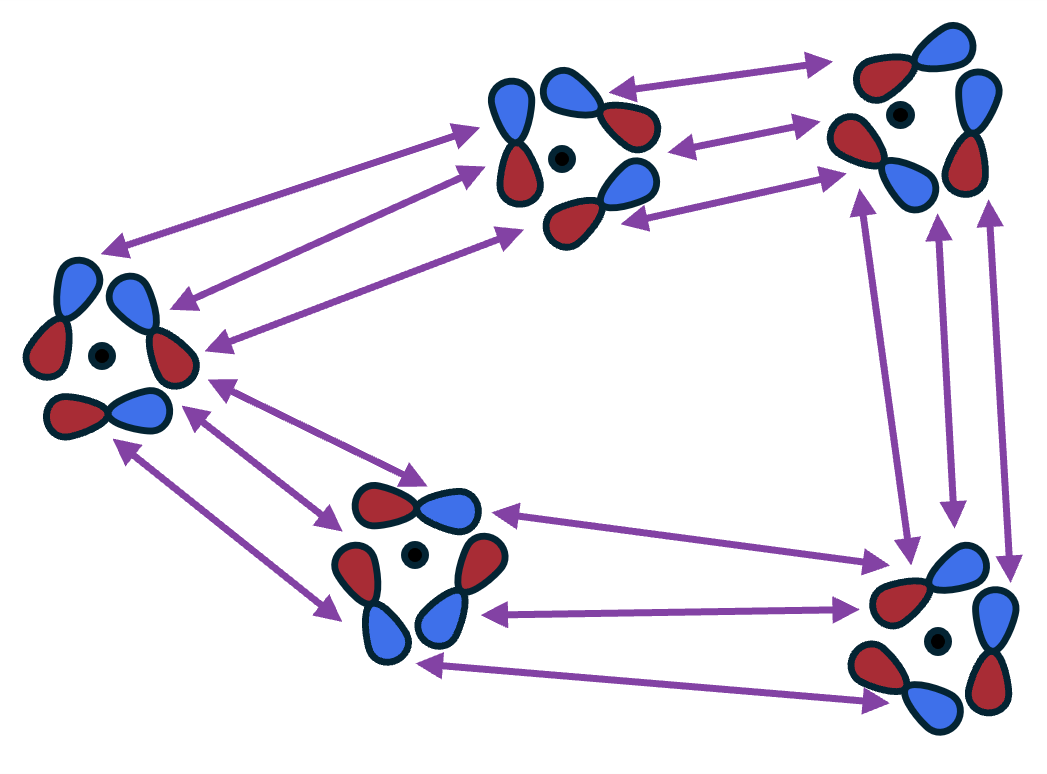
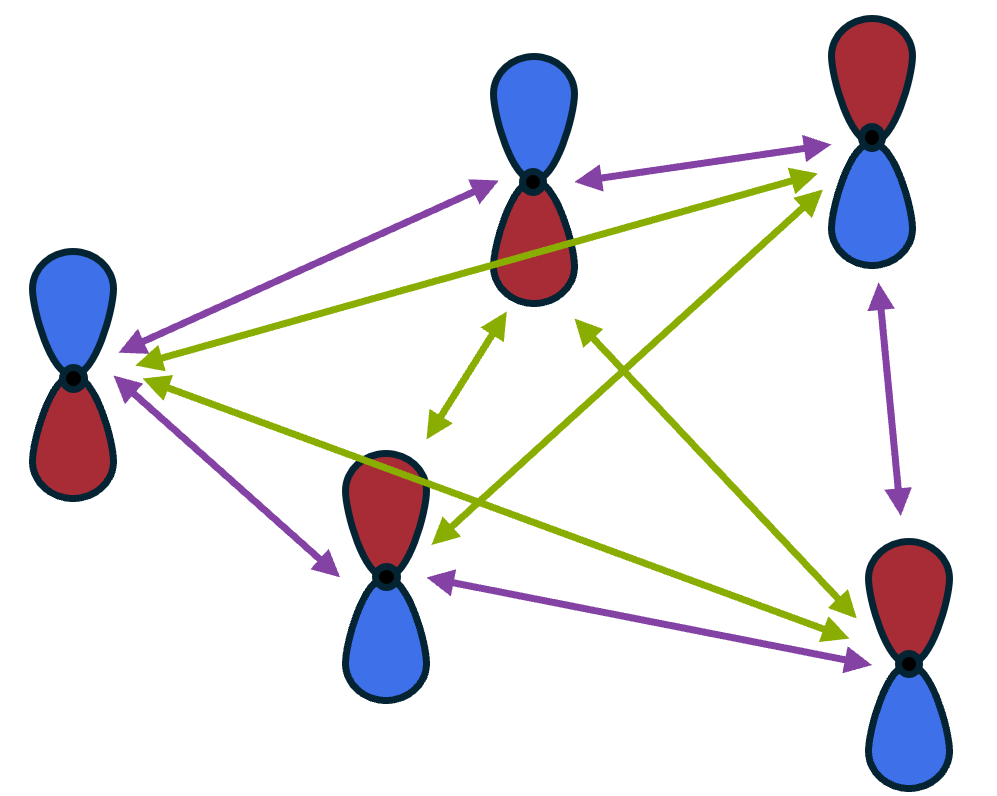
| 12:45, 27 February 2025 | Mbd.png (file) |  |
44 KB | Csheldon | Dipole-dipole interactions between atoms (black dots) in many-body dispersions (includes additional 3-, 4-, N-body dipole interaction terms. | 1 |
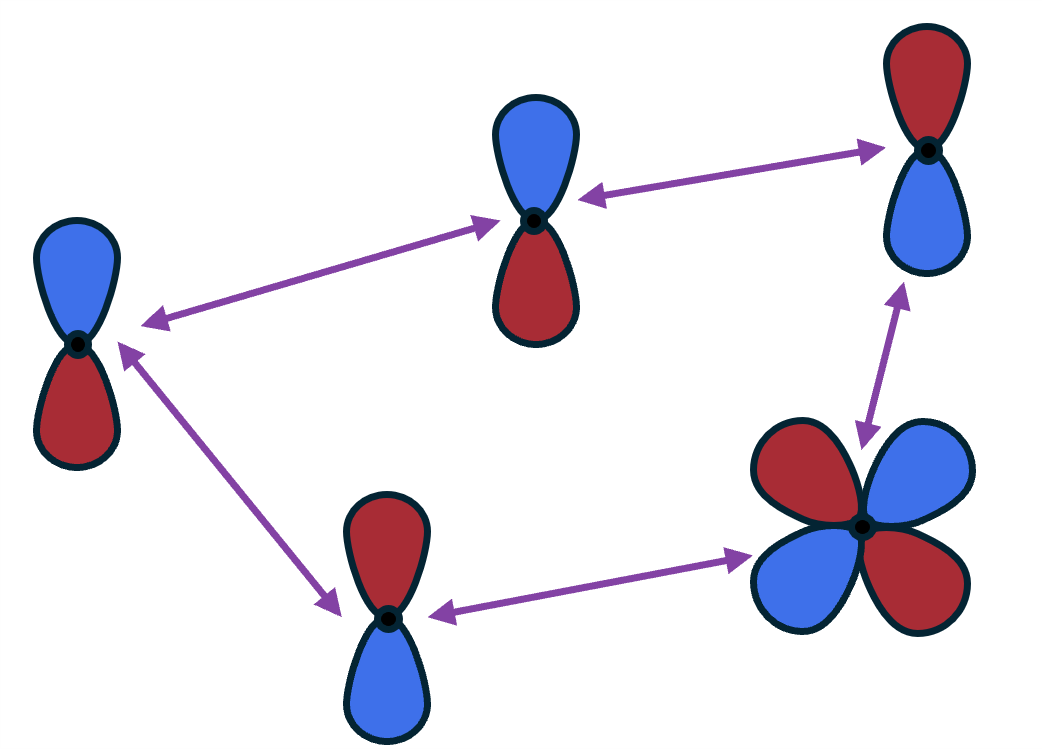
| 12:45, 27 February 2025 | Dft+d.png (file) |  |
41 KB | Csheldon | Dipole-dipole interactions between atoms (black dots) and quadrupole-dipole interactions (in some cases) | 1 |
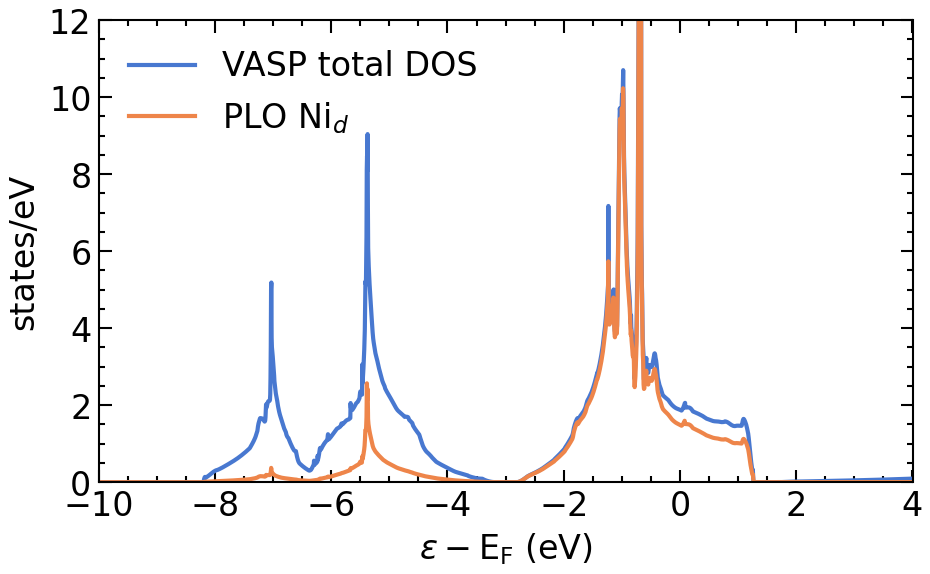
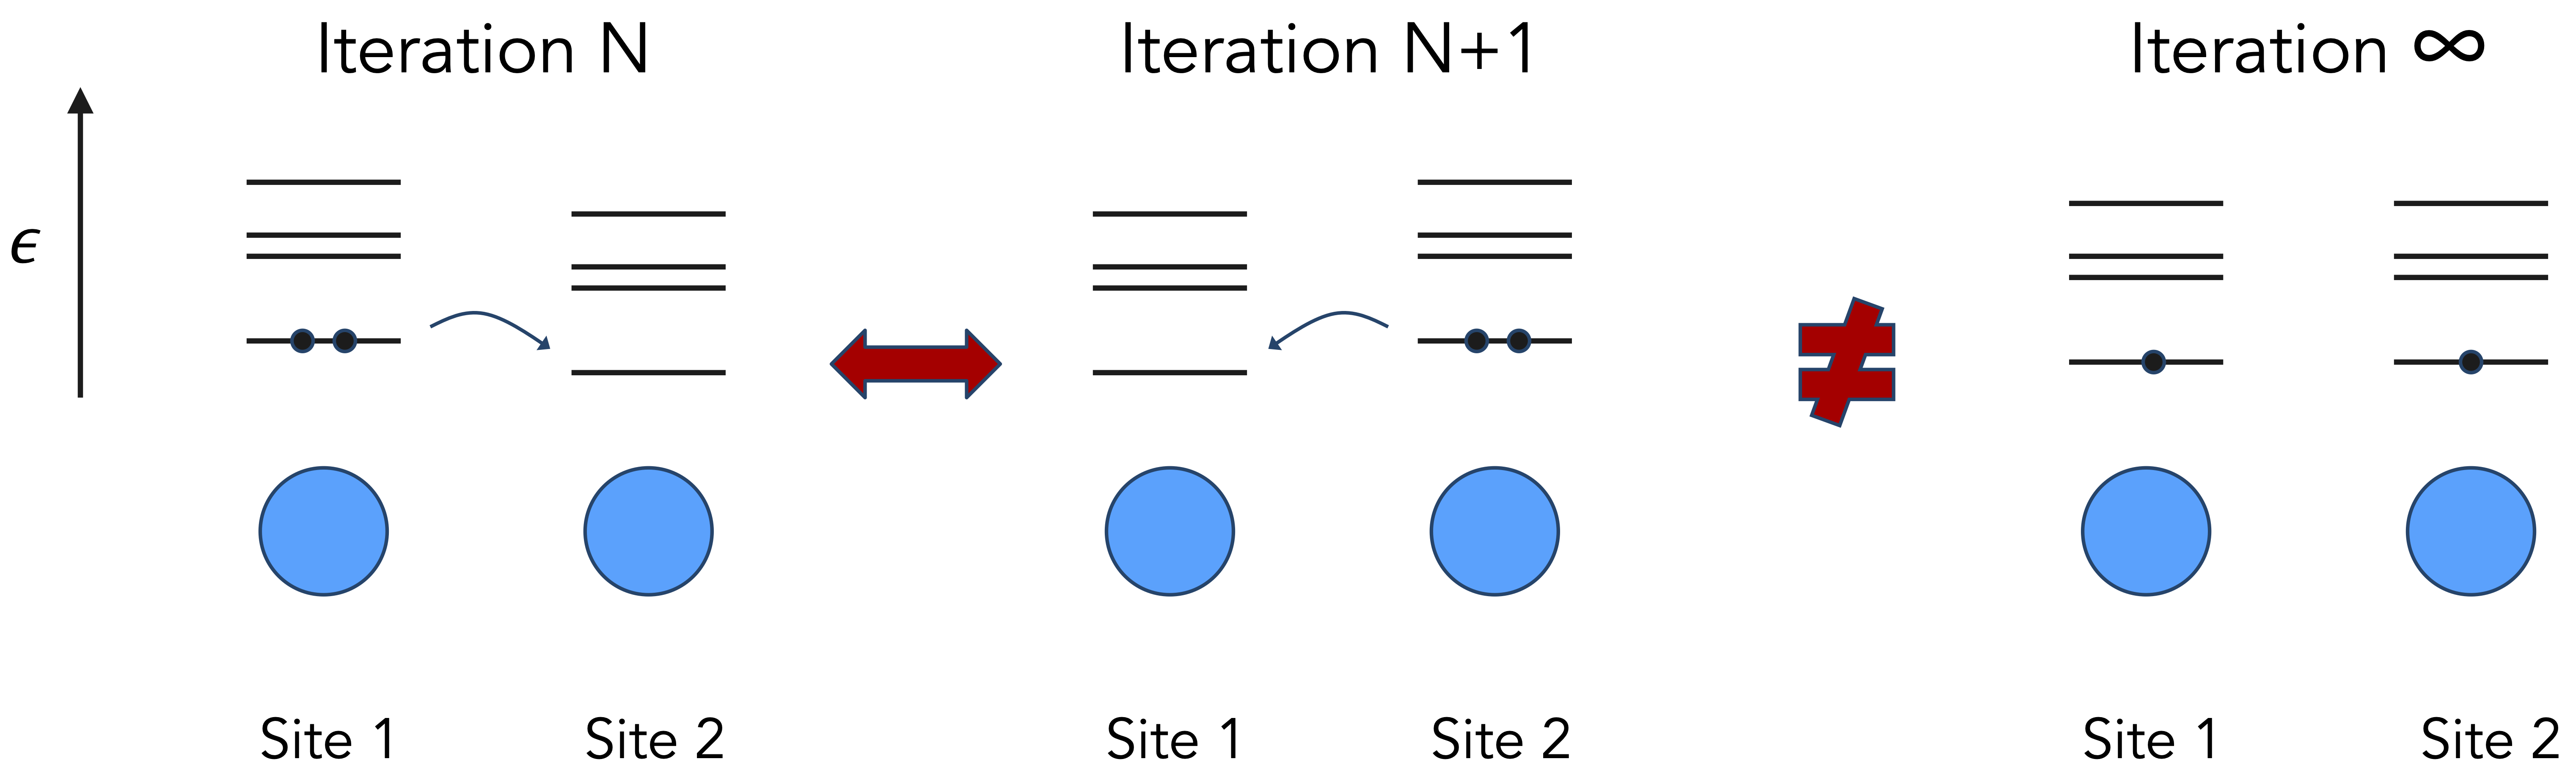
| 11:43, 27 February 2025 | Dft dmft tutorial 1.png (file) |  |
61 KB | Hampel | 2 | |
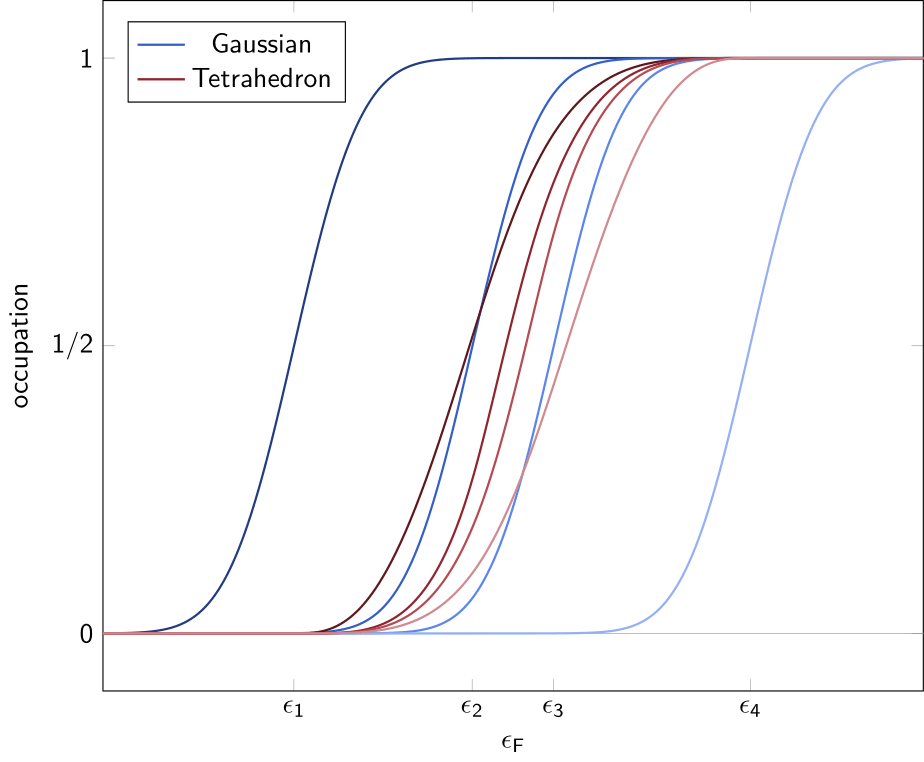
| 10:03, 27 February 2025 | Tetrahedron.png (file) |  |
41 KB | Schlipf | 1 | |
| 09:08, 27 February 2025 | Dft dmft tutorial 4.png (file) |  |
49 KB | Hampel | 2 | |
| 08:53, 27 February 2025 | Dft dmft tutorial 3.png (file) |  |
93 KB | Hampel | 1 | |
| 08:52, 27 February 2025 | Dft dmft tutorial 2.png (file) |  |
68 KB | Hampel | 1 | |
| 08:25, 27 February 2025 | Hyperfine coupling.png (file) |  |
656 KB | Csheldon | Changed N atom internal to be paler | 4 |
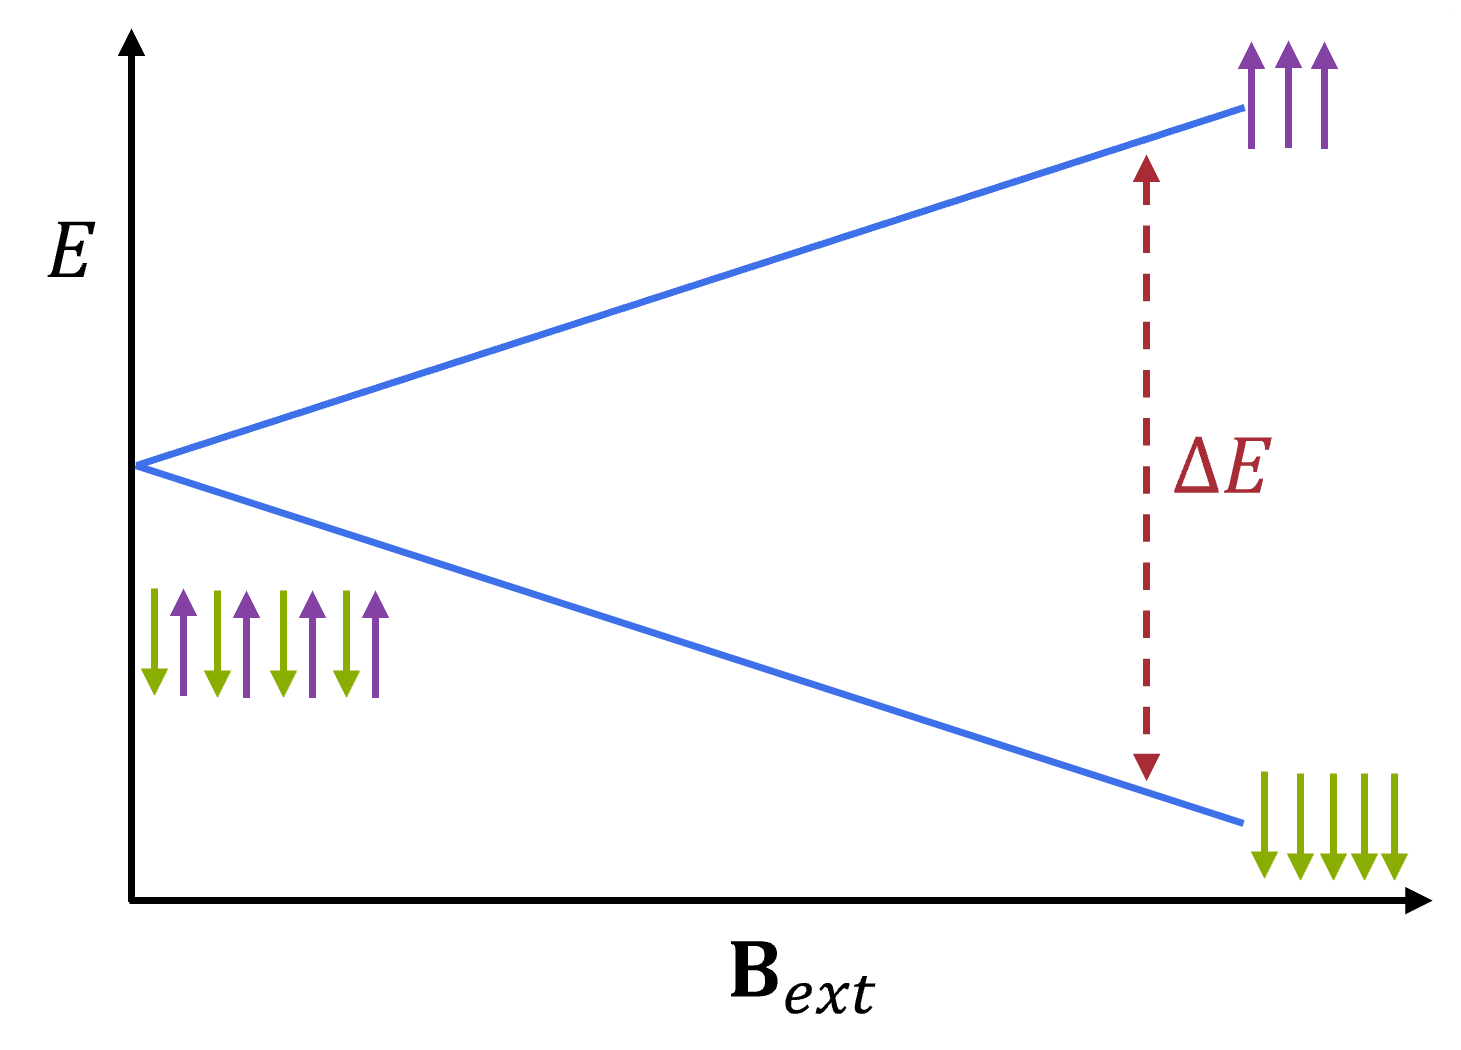
| 08:12, 27 February 2025 | Spin energy split new colours.png (file) |  |
38 KB | Csheldon | Changed B to B_ext | 2 |
| 08:01, 27 February 2025 | Integrated.png (file) |  |
27 KB | Schlipf | 1 | |
| 08:00, 27 February 2025 | Chemical shielding.png (file) |  |
532 KB | Csheldon | Corrected the current to flow anticlockwise about the N atom | 4 |
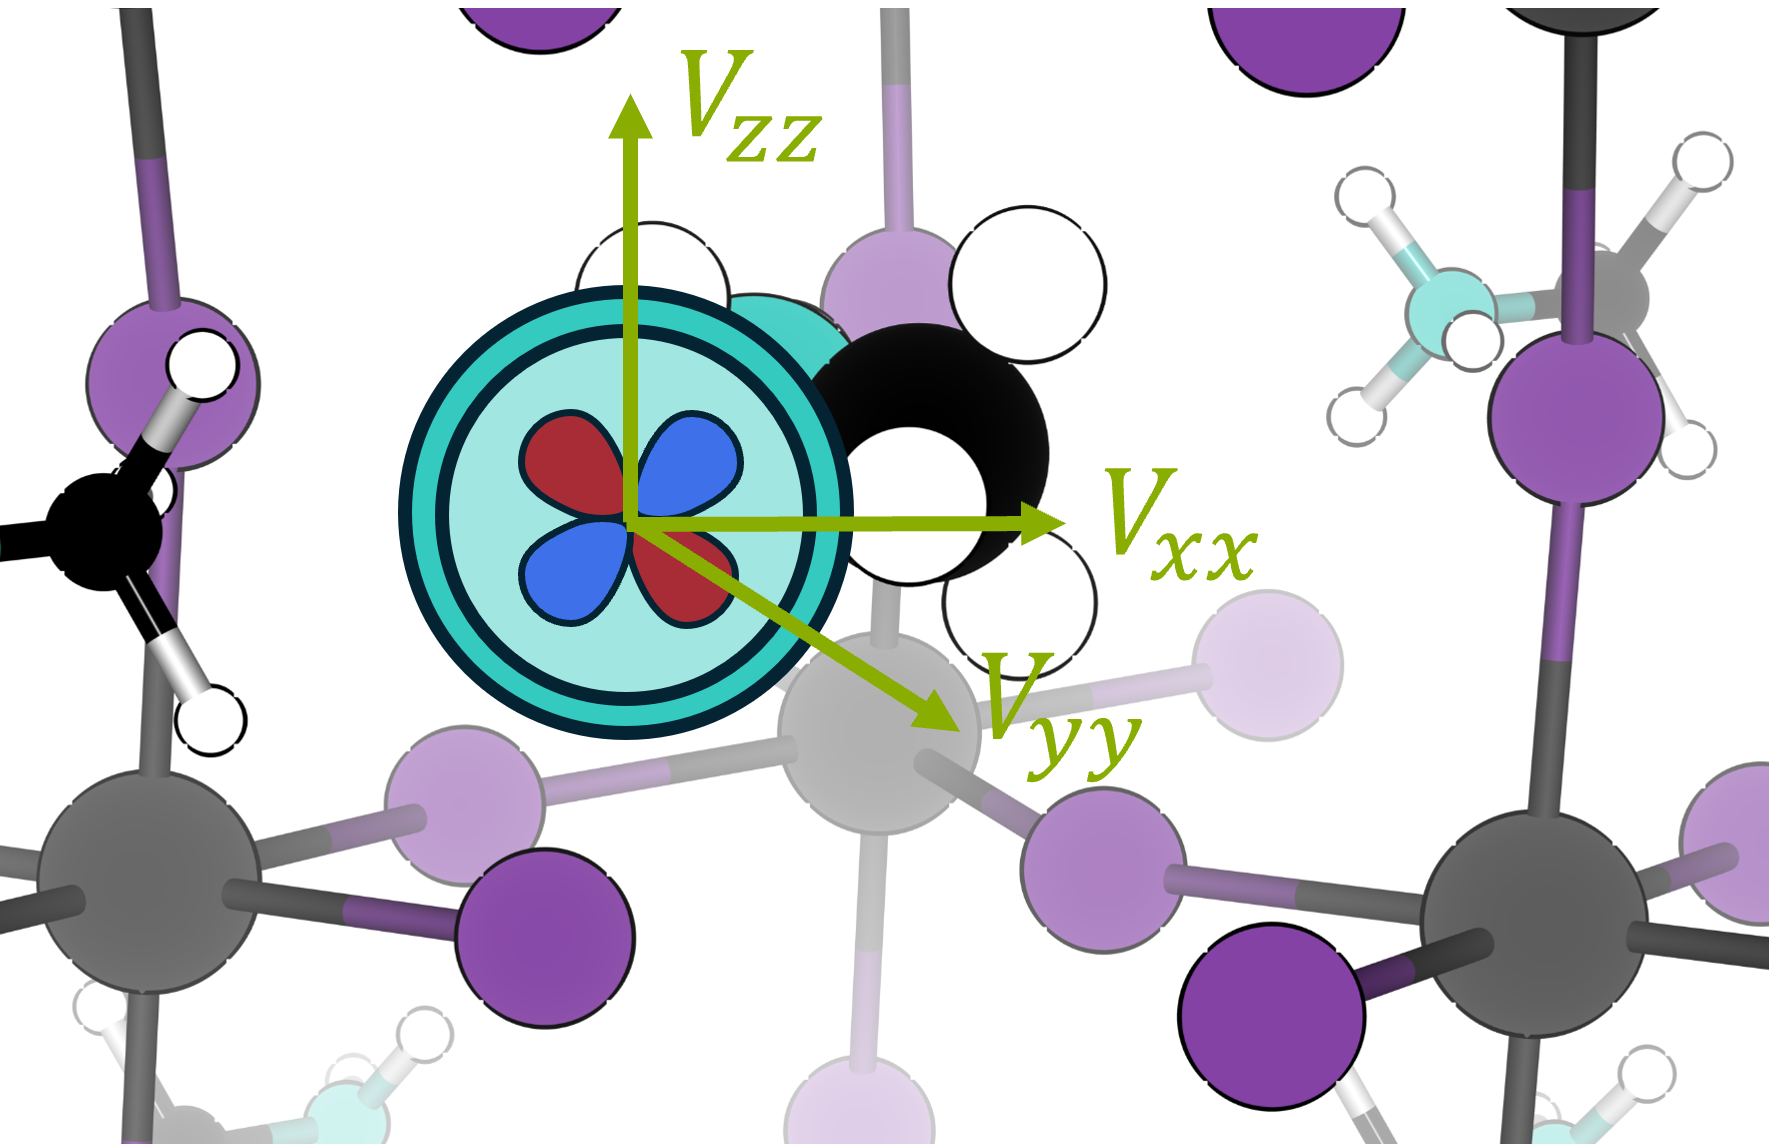
| 16:51, 26 February 2025 | Quadrupolar efg.png (file) |  |
474 KB | Csheldon | Made centre of N cyan | 3 |
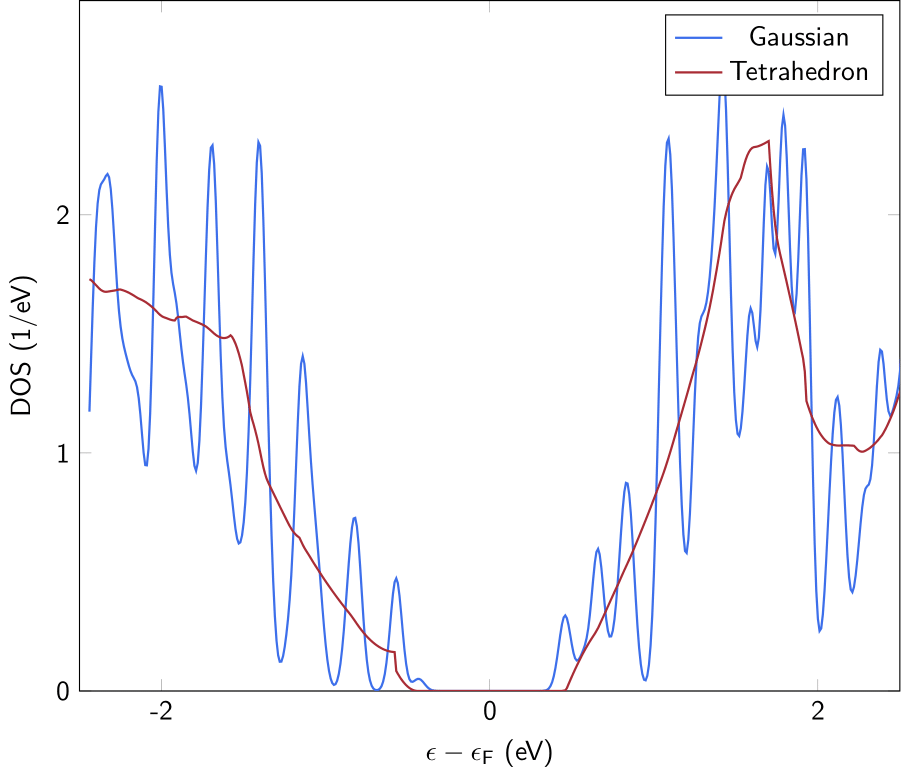
| 16:13, 24 February 2025 | Dos-gauss-tetra.png (file) |  |
58 KB | Schlipf | 2 | |
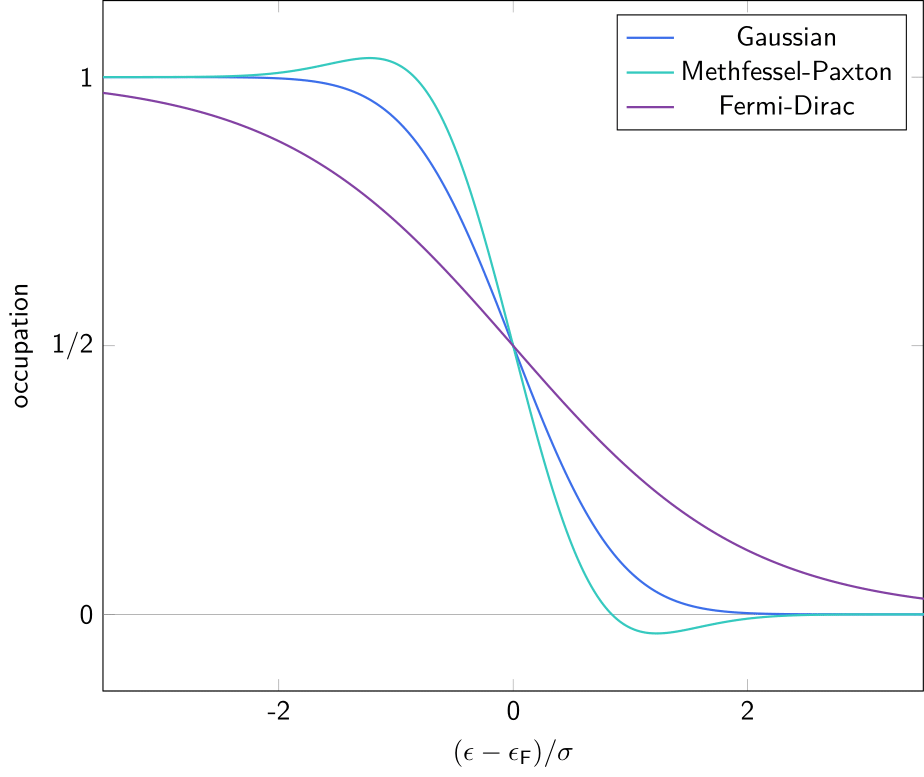
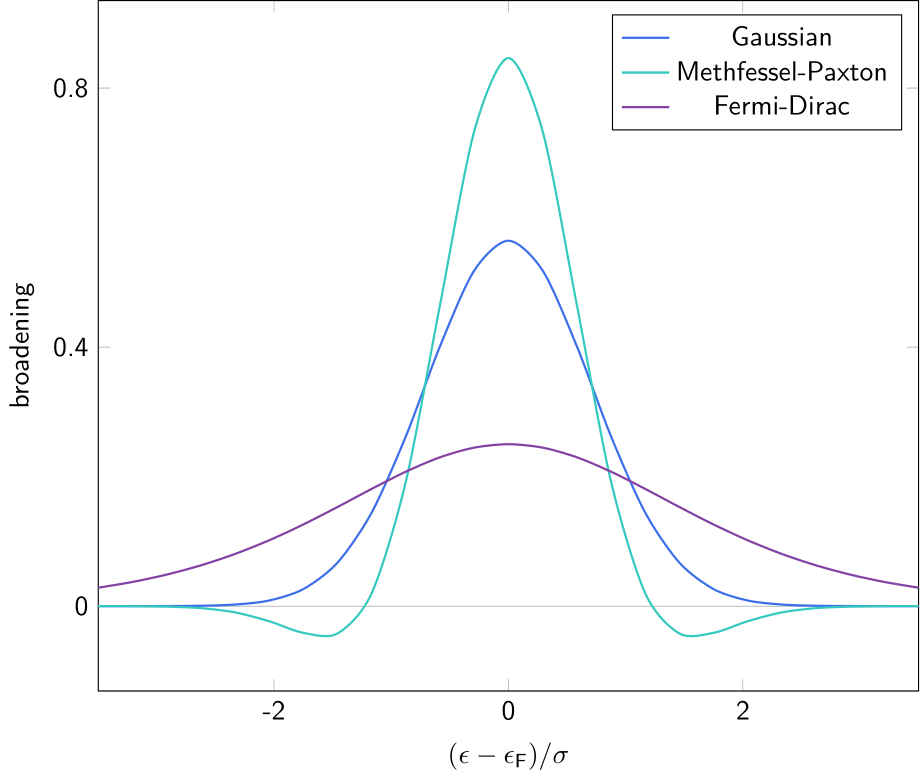
| 14:25, 24 February 2025 | Smearing.png (file) |  |
30 KB | Schlipf | 1 | |
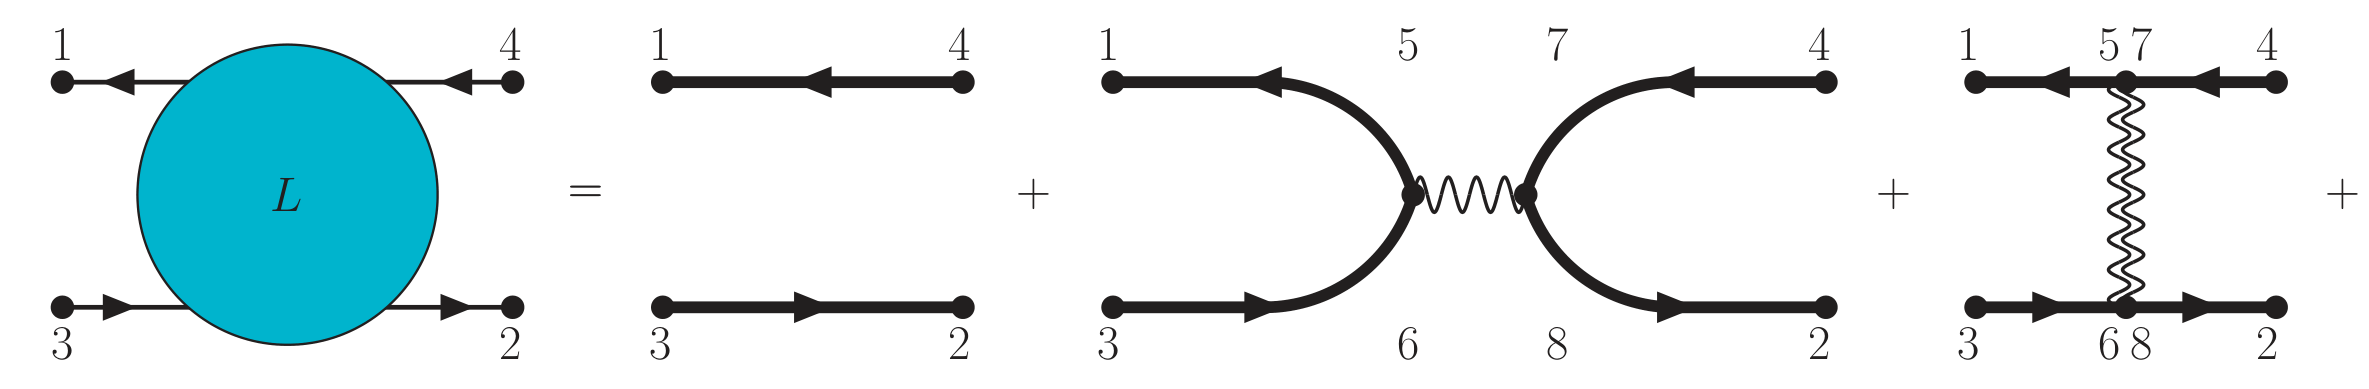
| 10:54, 21 February 2025 | Bse graph.png (file) | 60 KB | Tal | 2 | ||
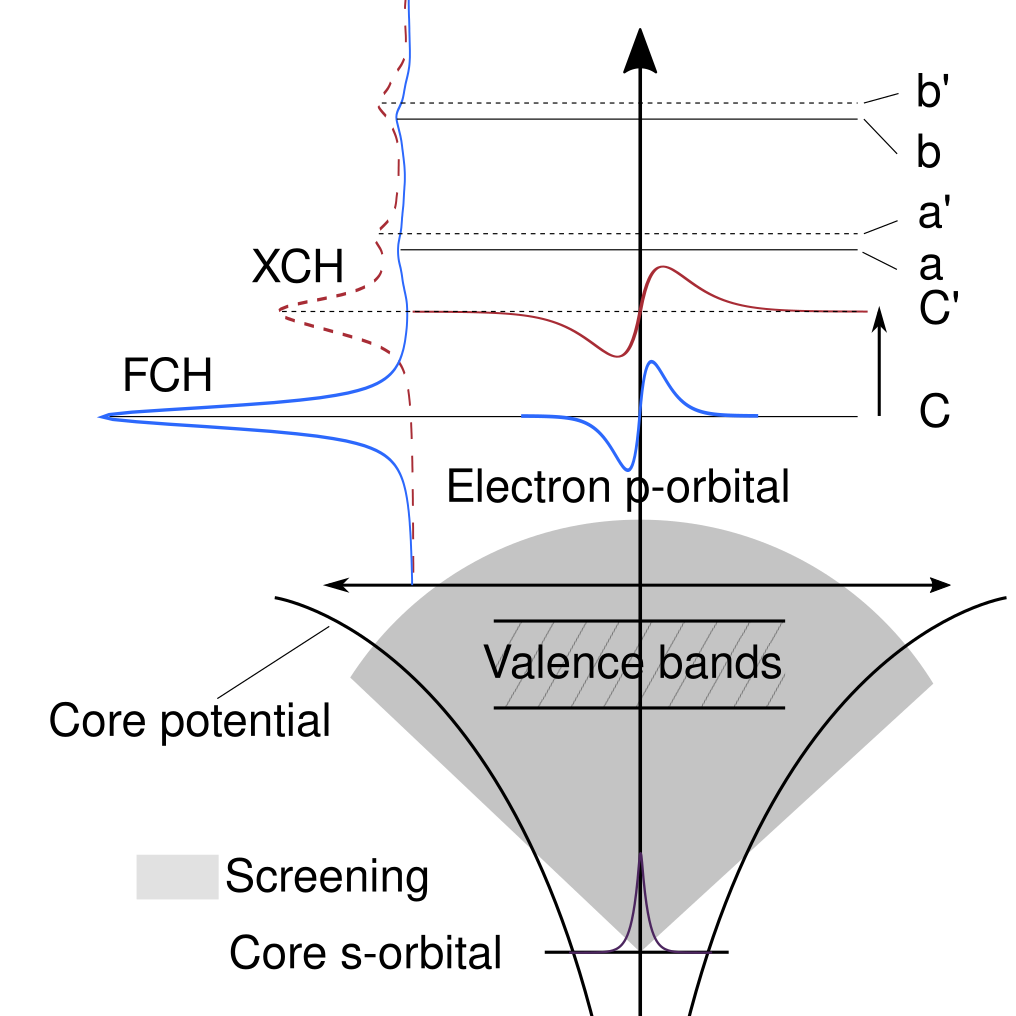
| 13:58, 19 February 2025 | Fch xch.png (file) |  |
116 KB | Tal | 1 | |
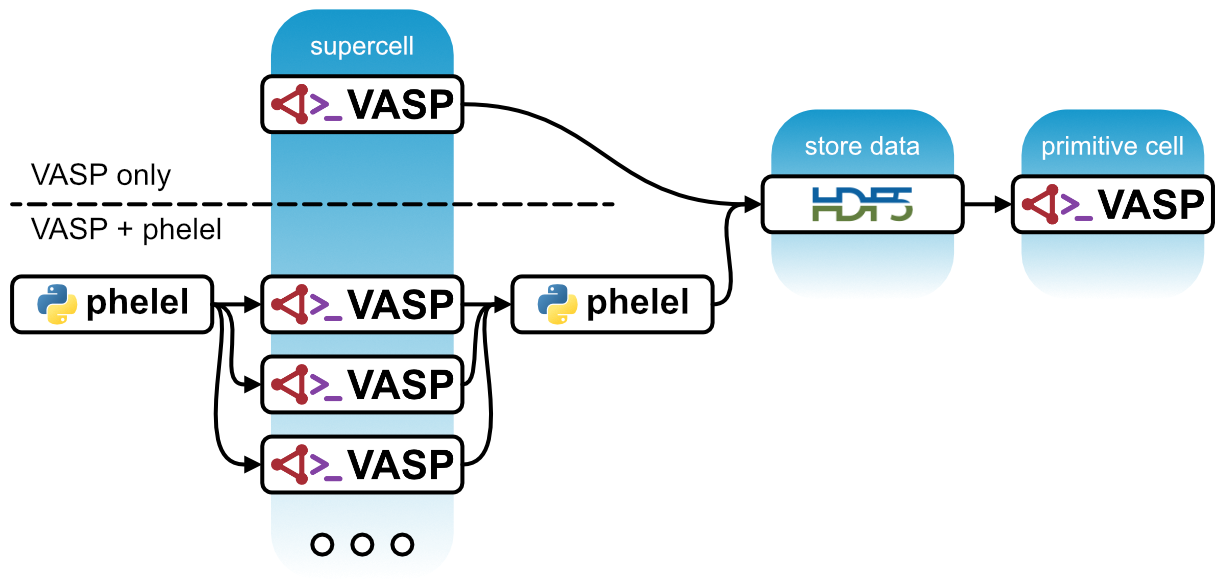
| 14:28, 23 January 2025 | Elphon-workflow.png (file) |  |
165 KB | Mani | Depicts two different workflows for the perturbative electron-phonon code. | 1 |
| 14:14, 23 January 2025 | Elphon-workflow.pdf (file) | 63 KB | Mani | Depicts two different workflows for the perturbative electron-phonon code. | 1 | |
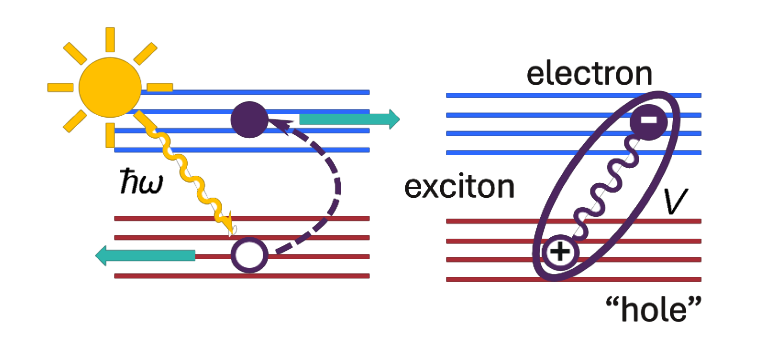
| 13:23, 19 December 2024 | Exciton.png (file) |  |
47 KB | Schlipf | 1 | |
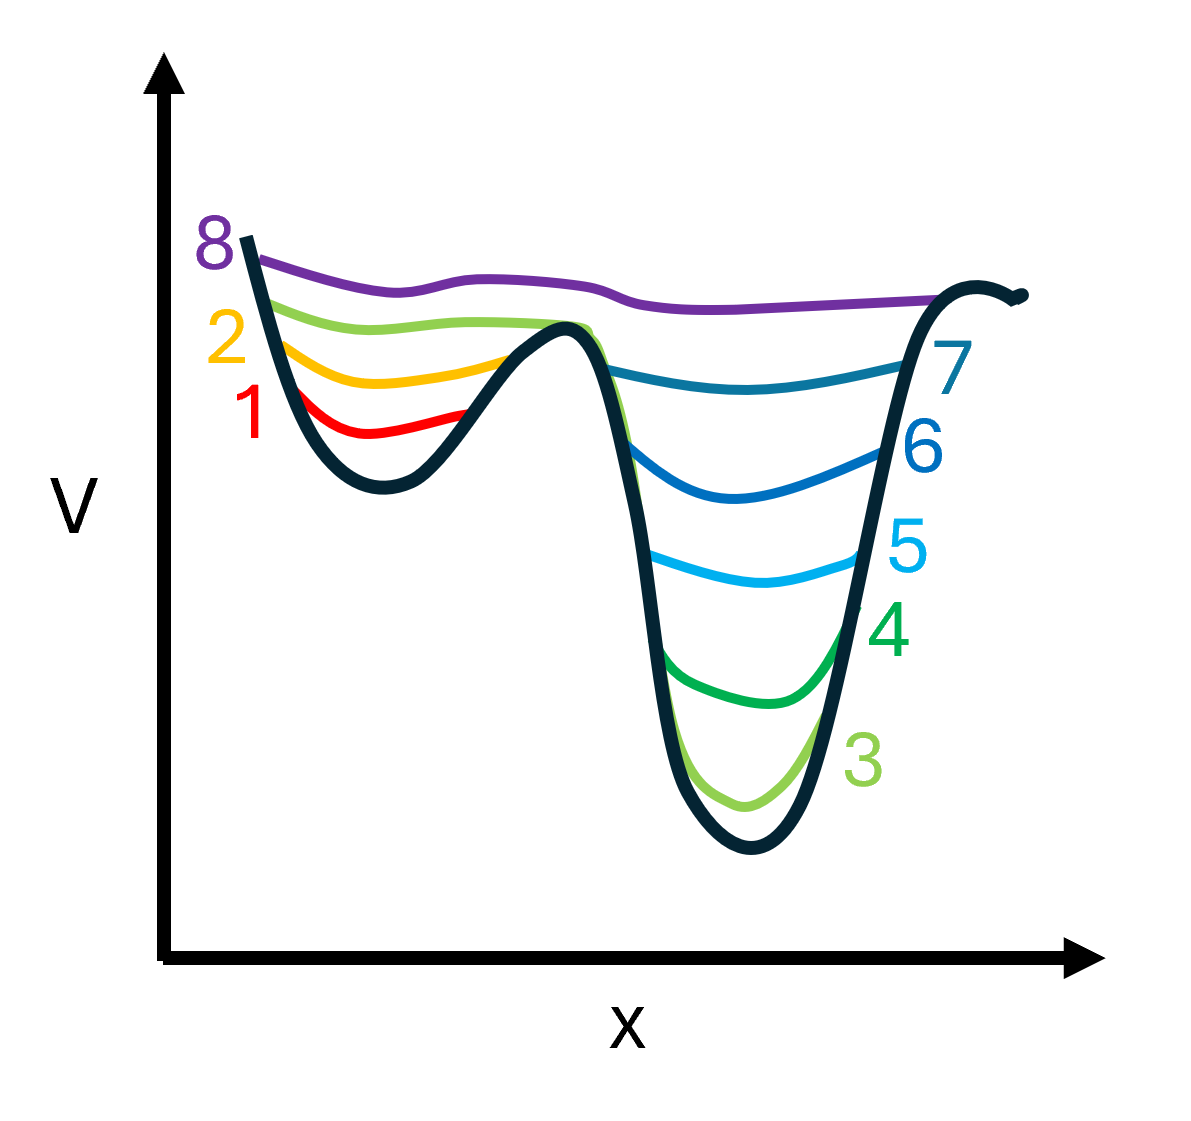
| 16:05, 30 October 2024 | Metadynamics.png (file) |  |
69 KB | Csheldon | Corrected colour for line 7 | 2 |
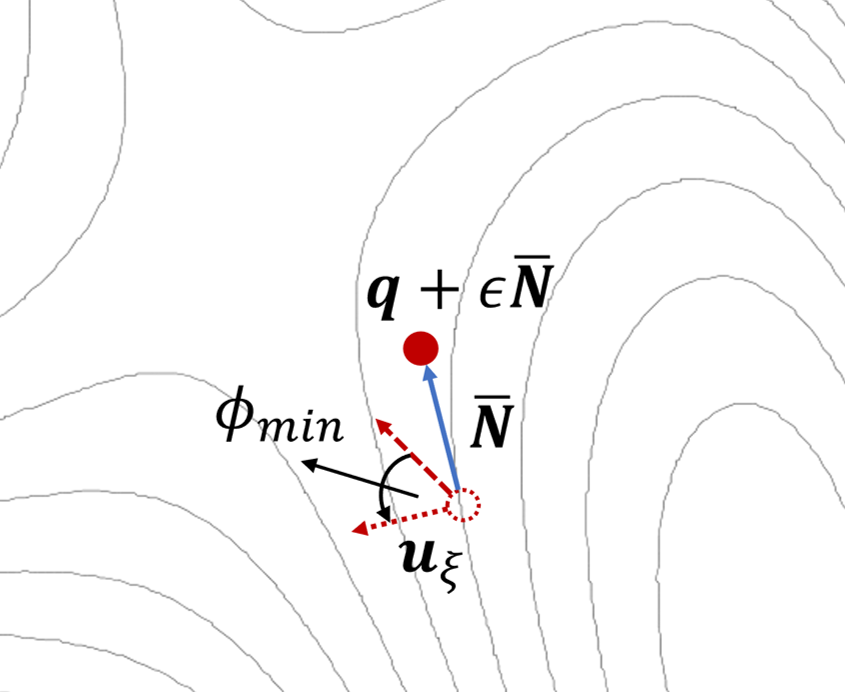
| 08:05, 18 October 2024 | Idm single image.png (file) |  |
86 KB | Csheldon | step d IDM plot from Tomas Bucko | 1 |
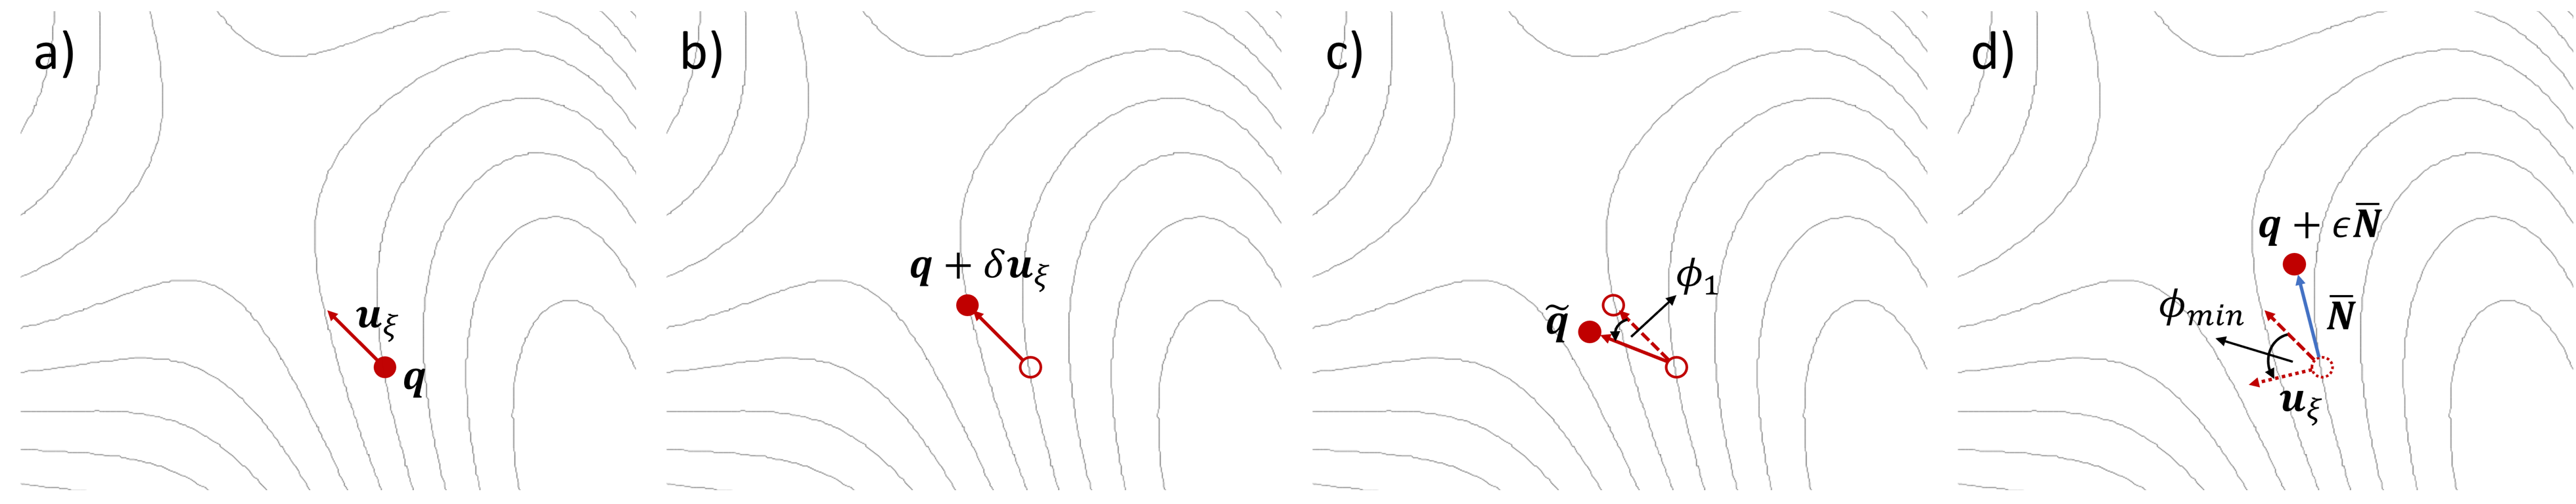
| 08:05, 18 October 2024 | IDM.png (file) | 290 KB | Csheldon | IDM plot from Tomas Bucko | 1 | |
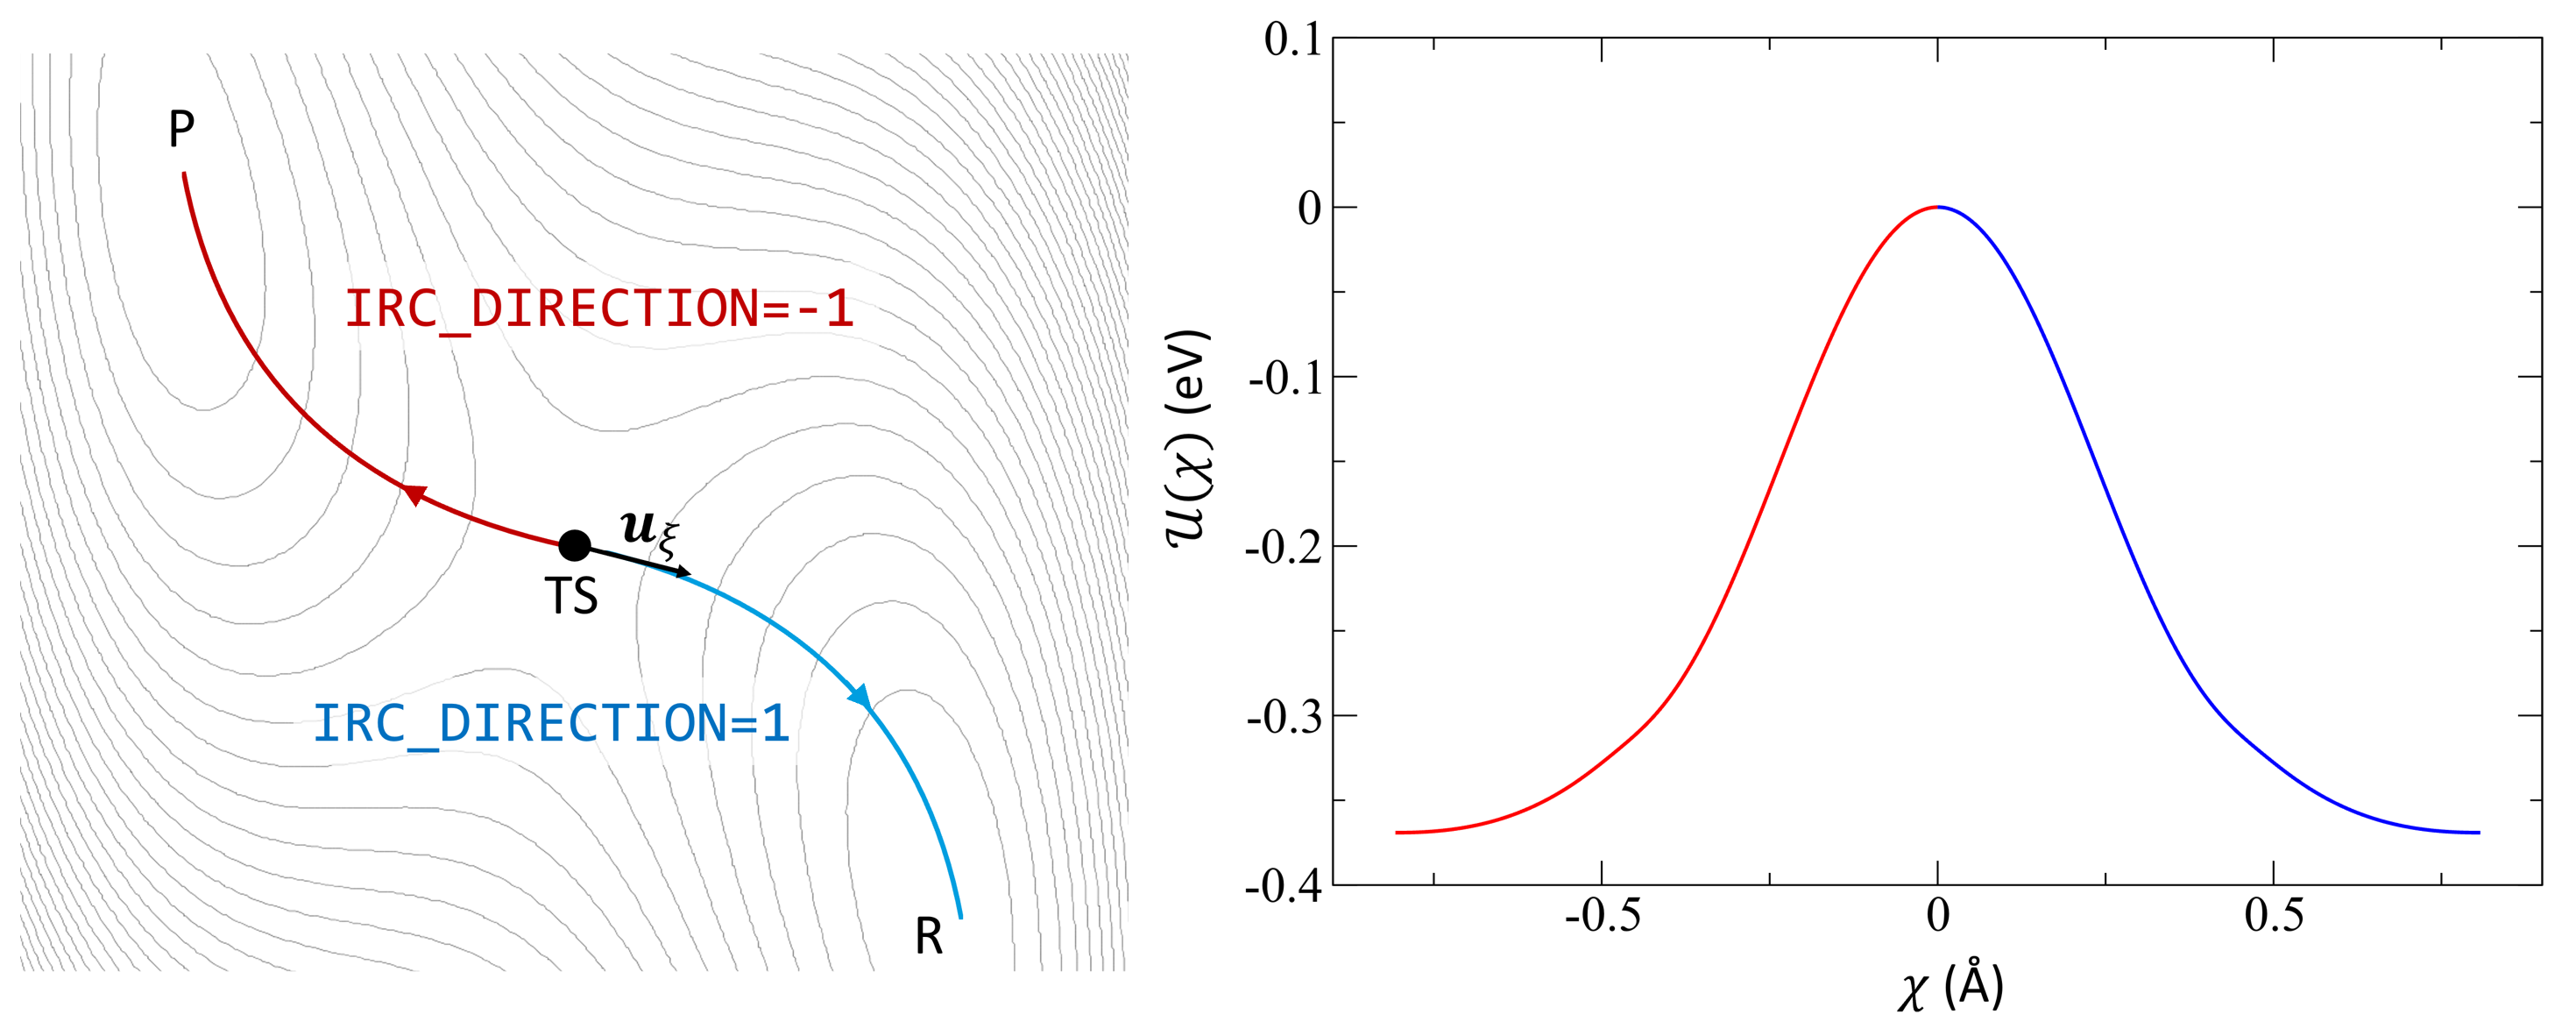
| 08:04, 18 October 2024 | IRC.png (file) |  |
450 KB | Csheldon | IRC plot from Tomas Bucko | 1 |
| 16:06, 17 October 2024 | TIMEEV bulk Si dielectric function py4vasp.png (file) |  |
59 KB | Pmelo | 3 | |
| 14:24, 16 October 2024 | TIMEEV bulk Si dielectric function.png (file) |  |
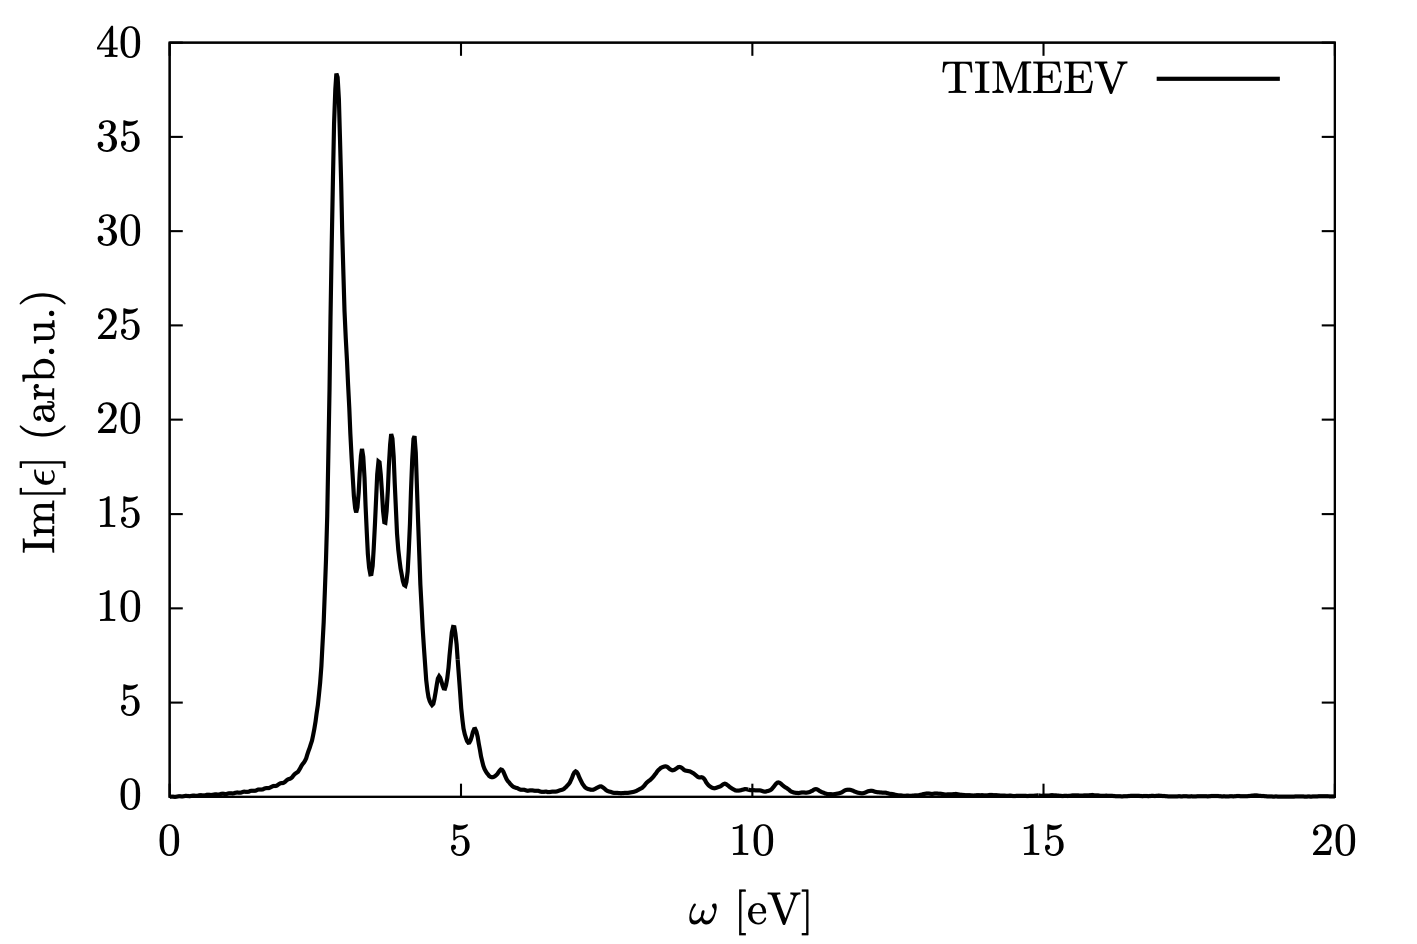
85 KB | Pmelo | Shows the imaginary part of the dielectric function of bulk Si from the example used in the Time-evolution page. | 1 |
| 14:18, 16 October 2024 | TIMEEV bulk Si dielectric function.pdf (file) | 27 KB | Pmelo | Shows the imaginary part of the dielectric function of bulk Si from the example used in the Time-evolution page. | 1 | |
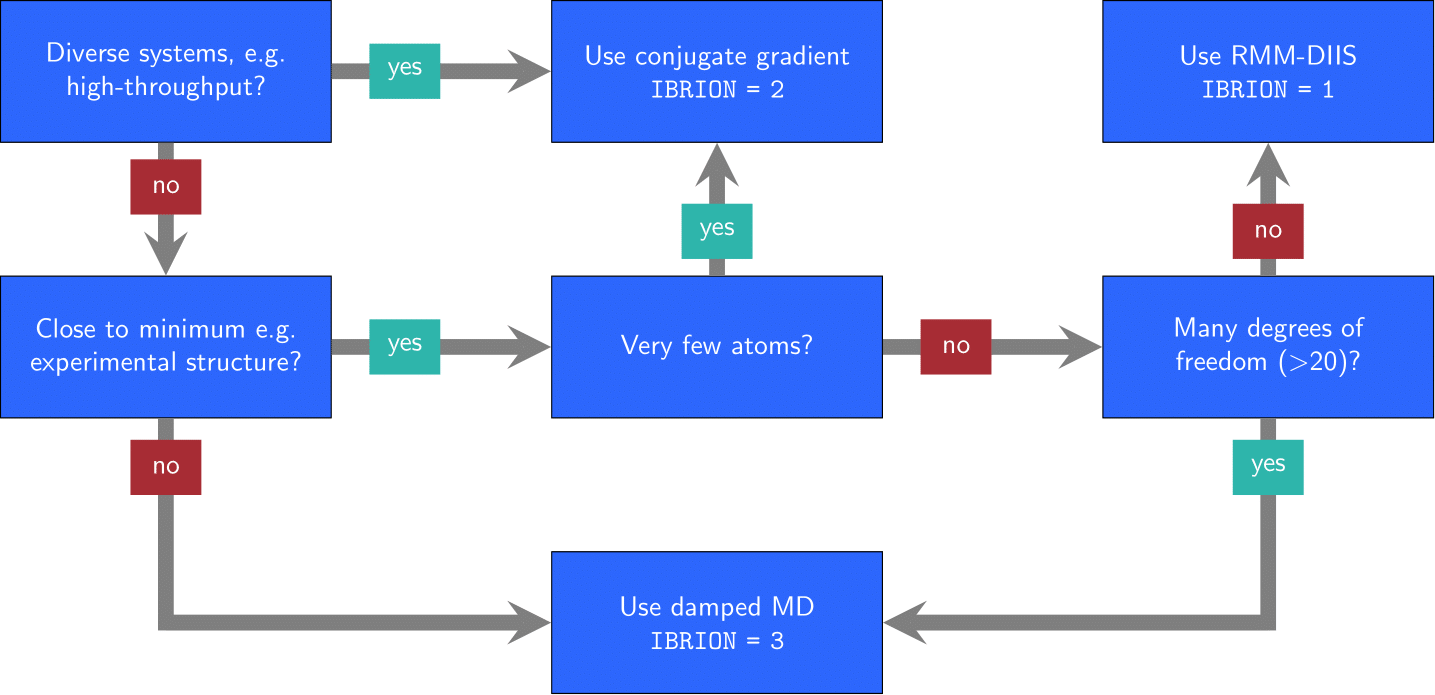
| 12:45, 15 October 2024 | Structure optimization.png (file) |  |
96 KB | Schlipf | 1 | |
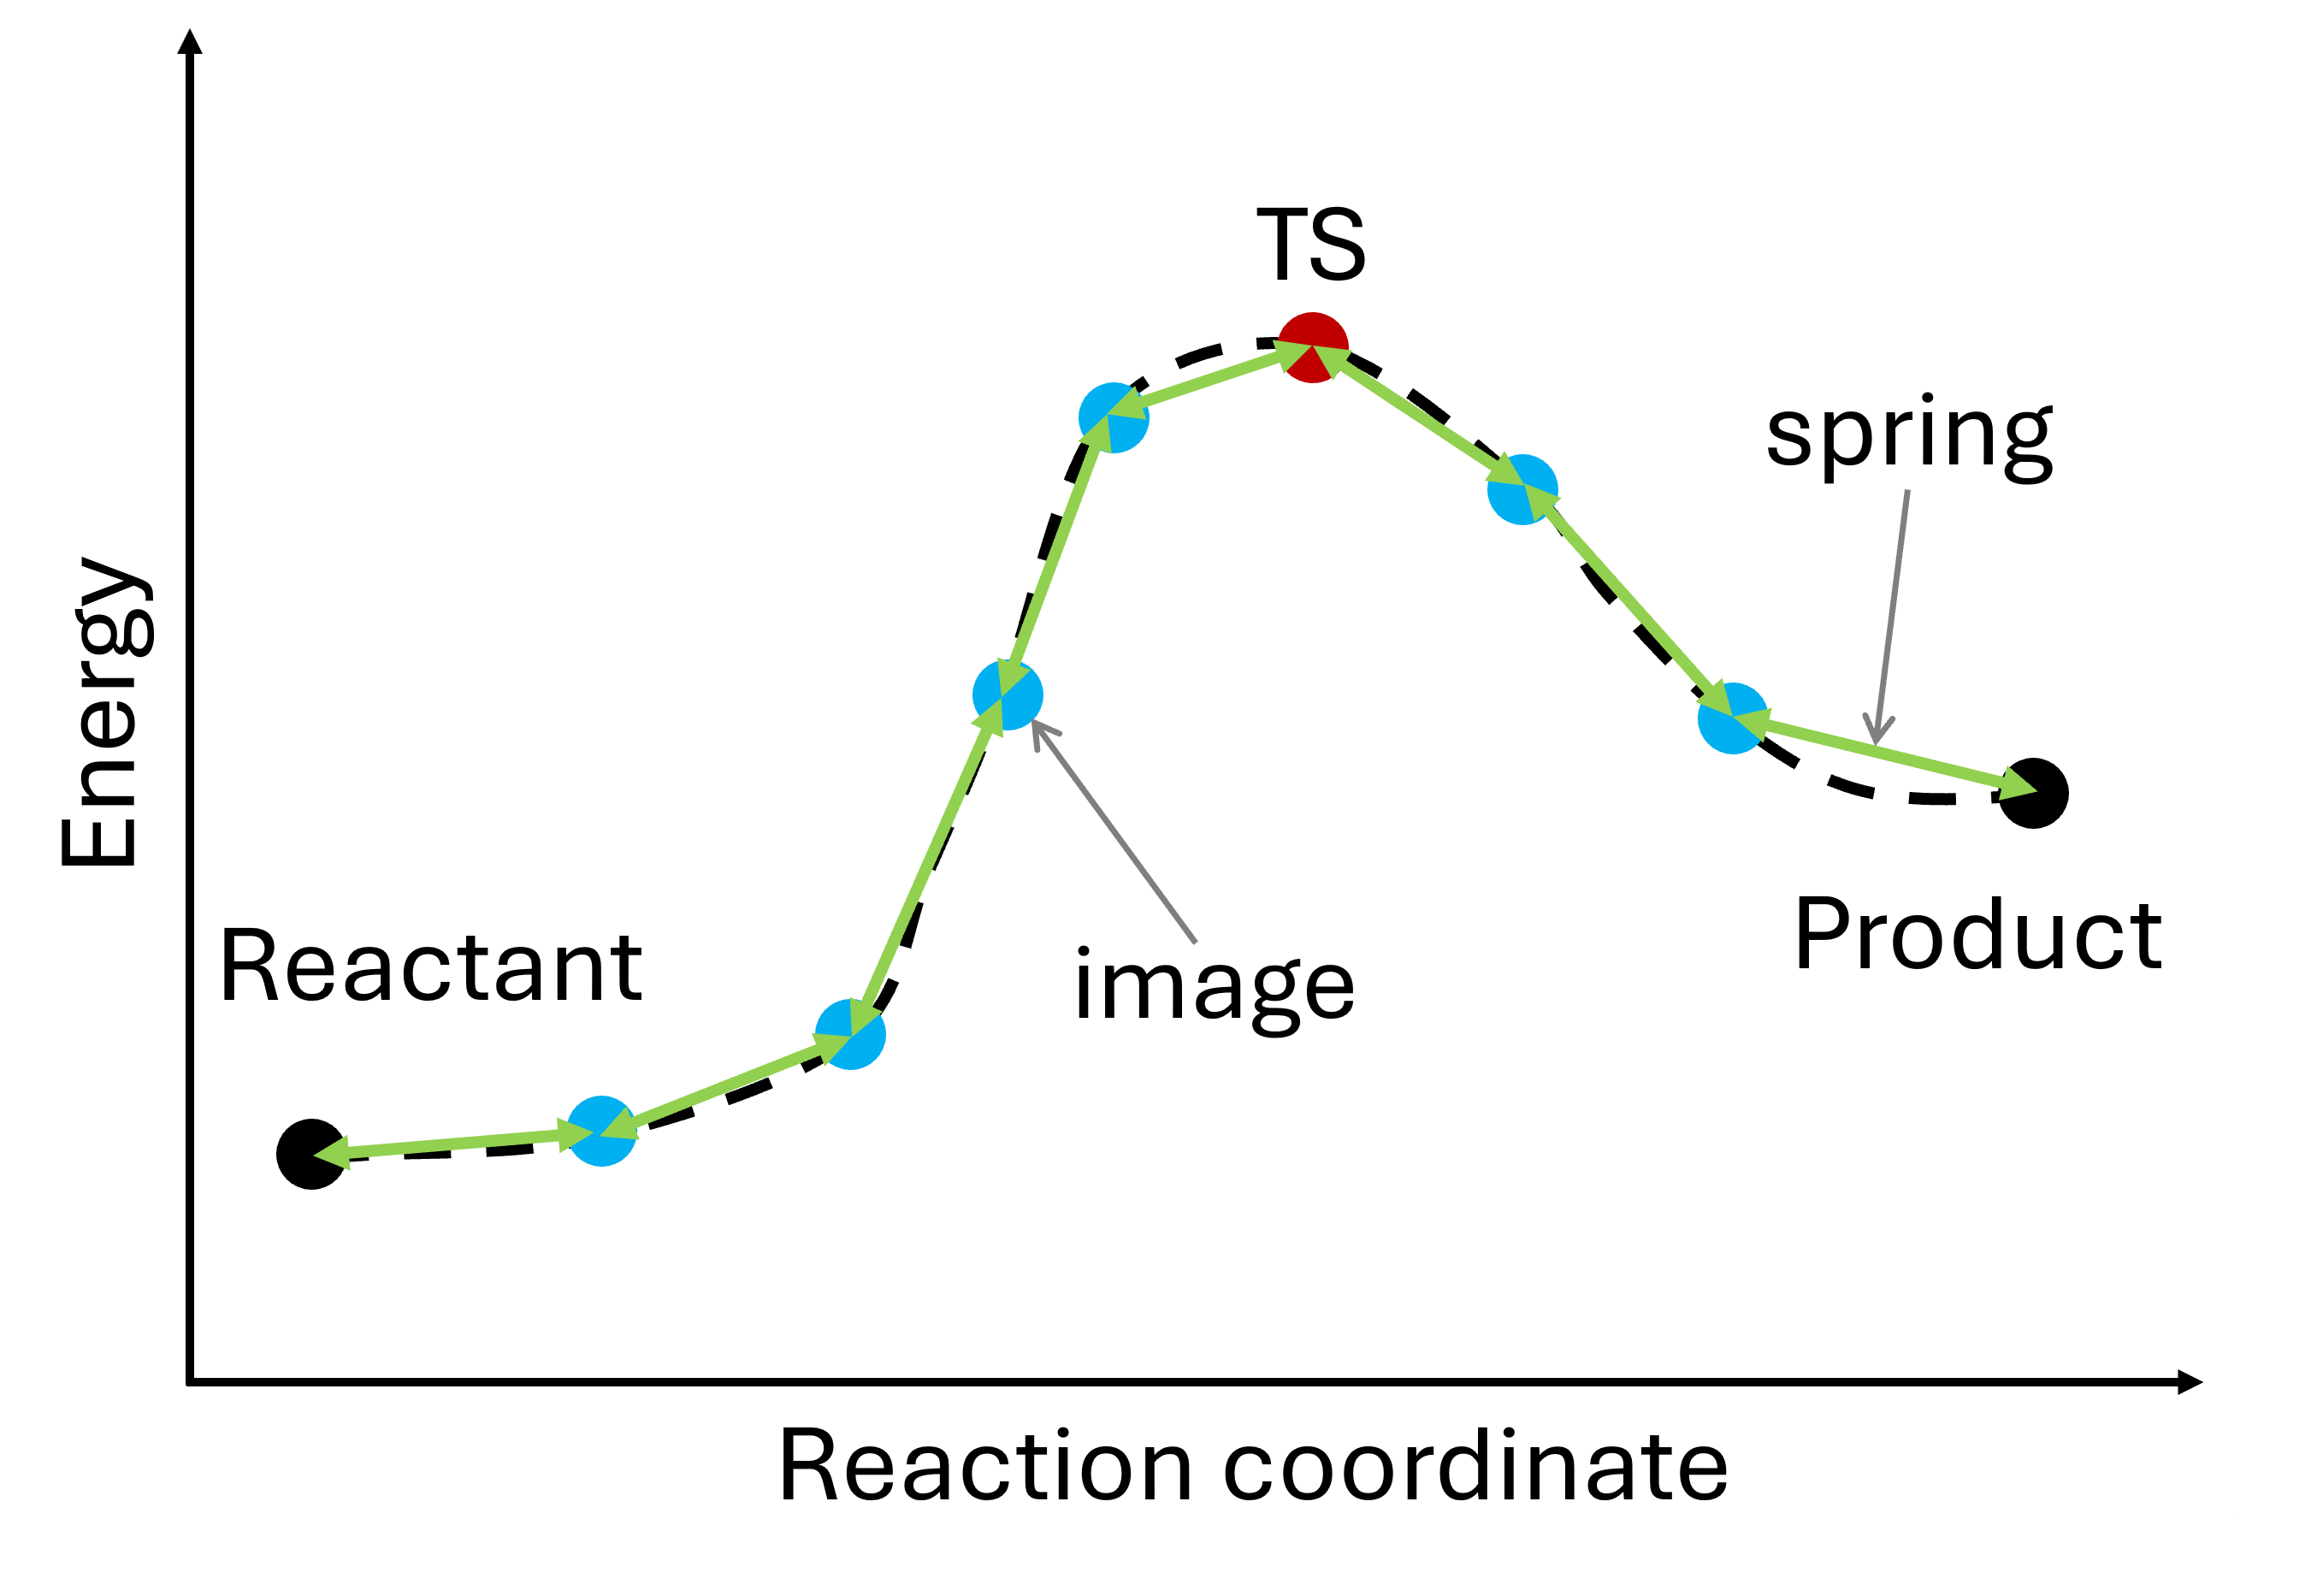
| 09:14, 15 October 2024 | NEB.png (file) |  |
132 KB | Csheldon | 1 | |
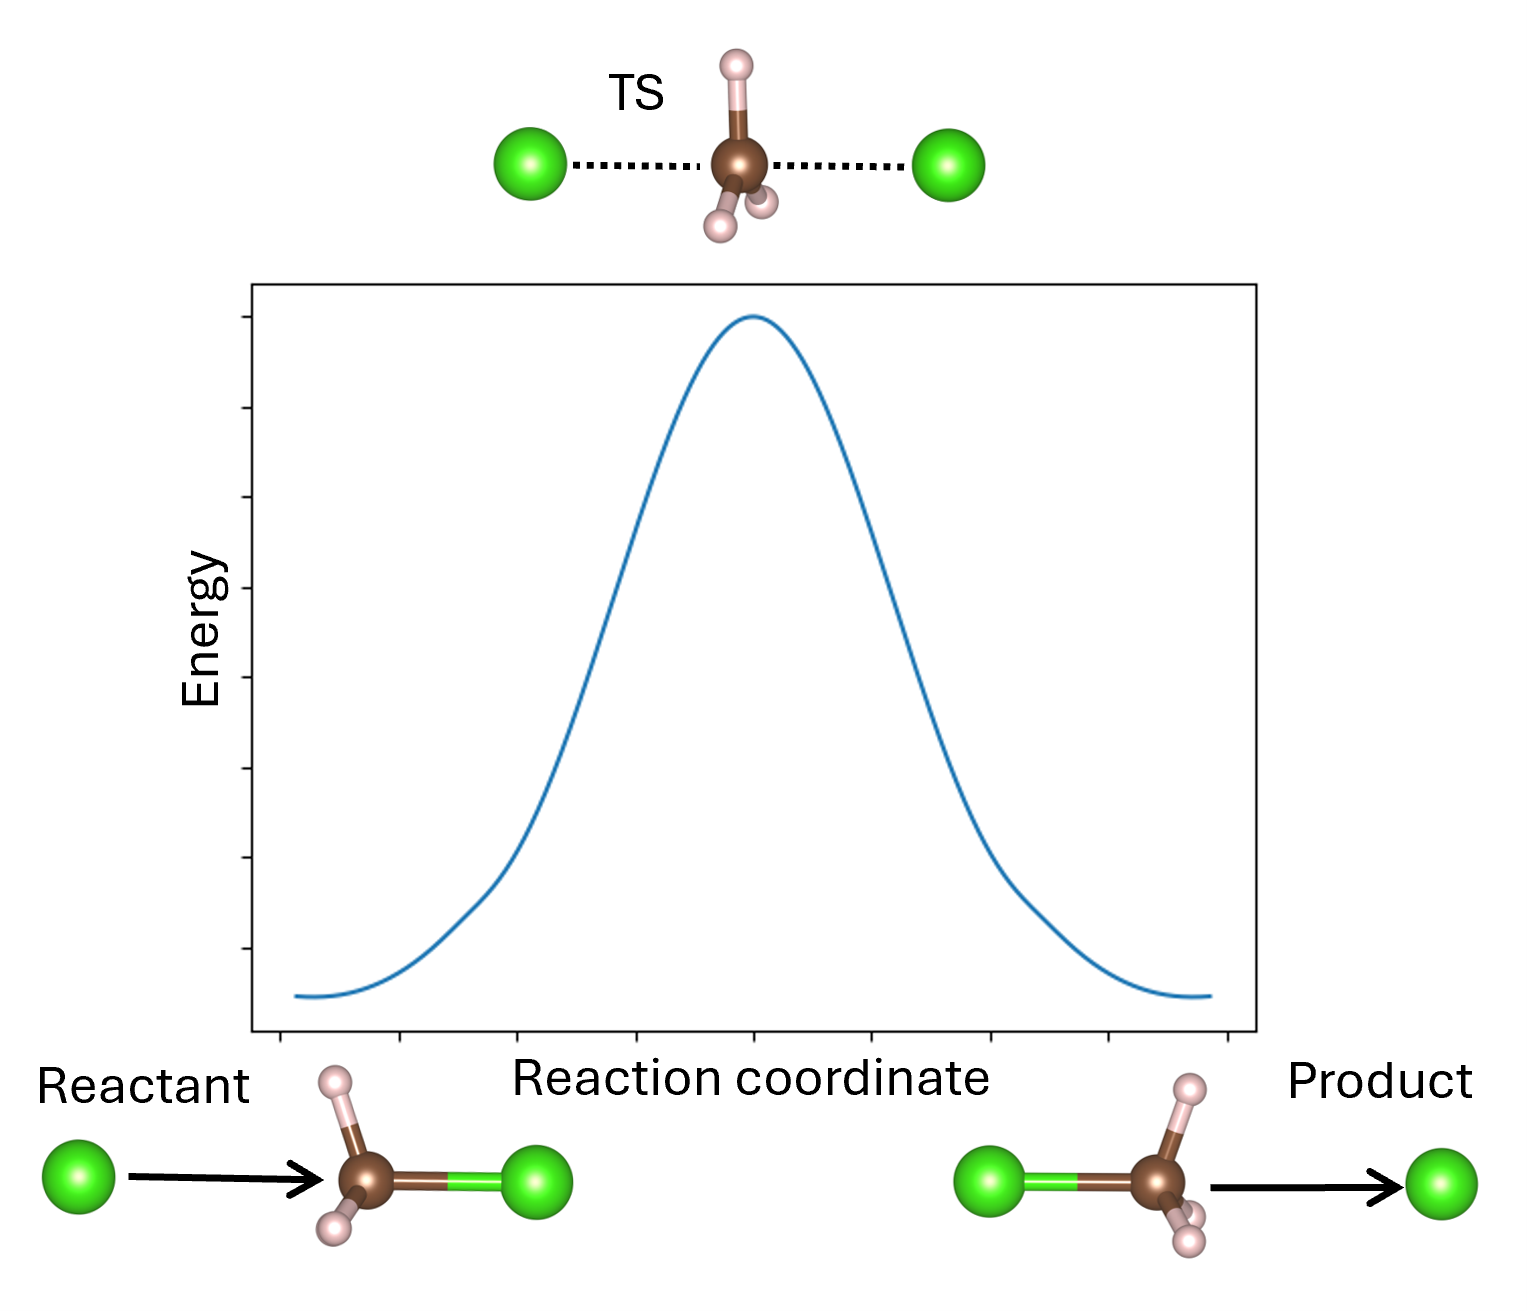
| 08:26, 15 October 2024 | Transition state pathway.png (file) | 206 KB | Csheldon | 4 | ||
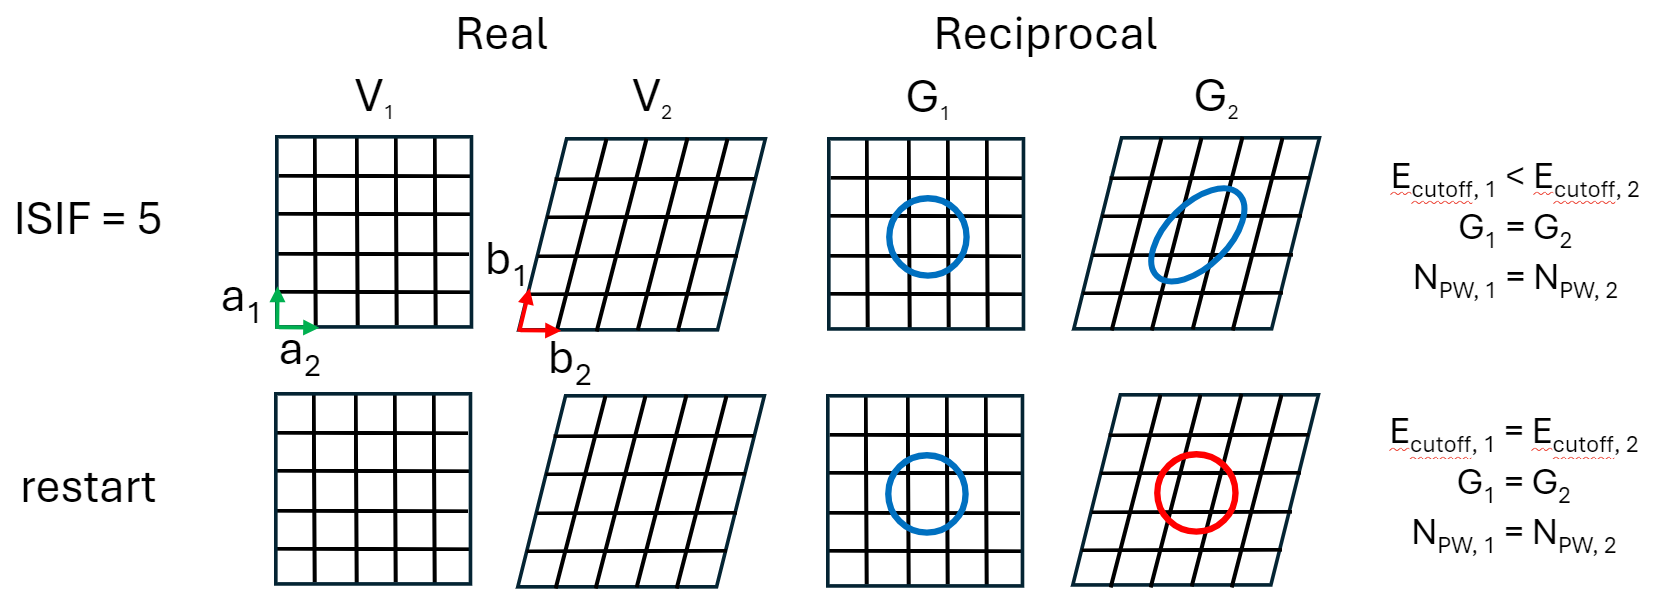
| 12:20, 31 July 2024 | Shape pulay grids.png (file) |  |
93 KB | Csheldon | 3 | |
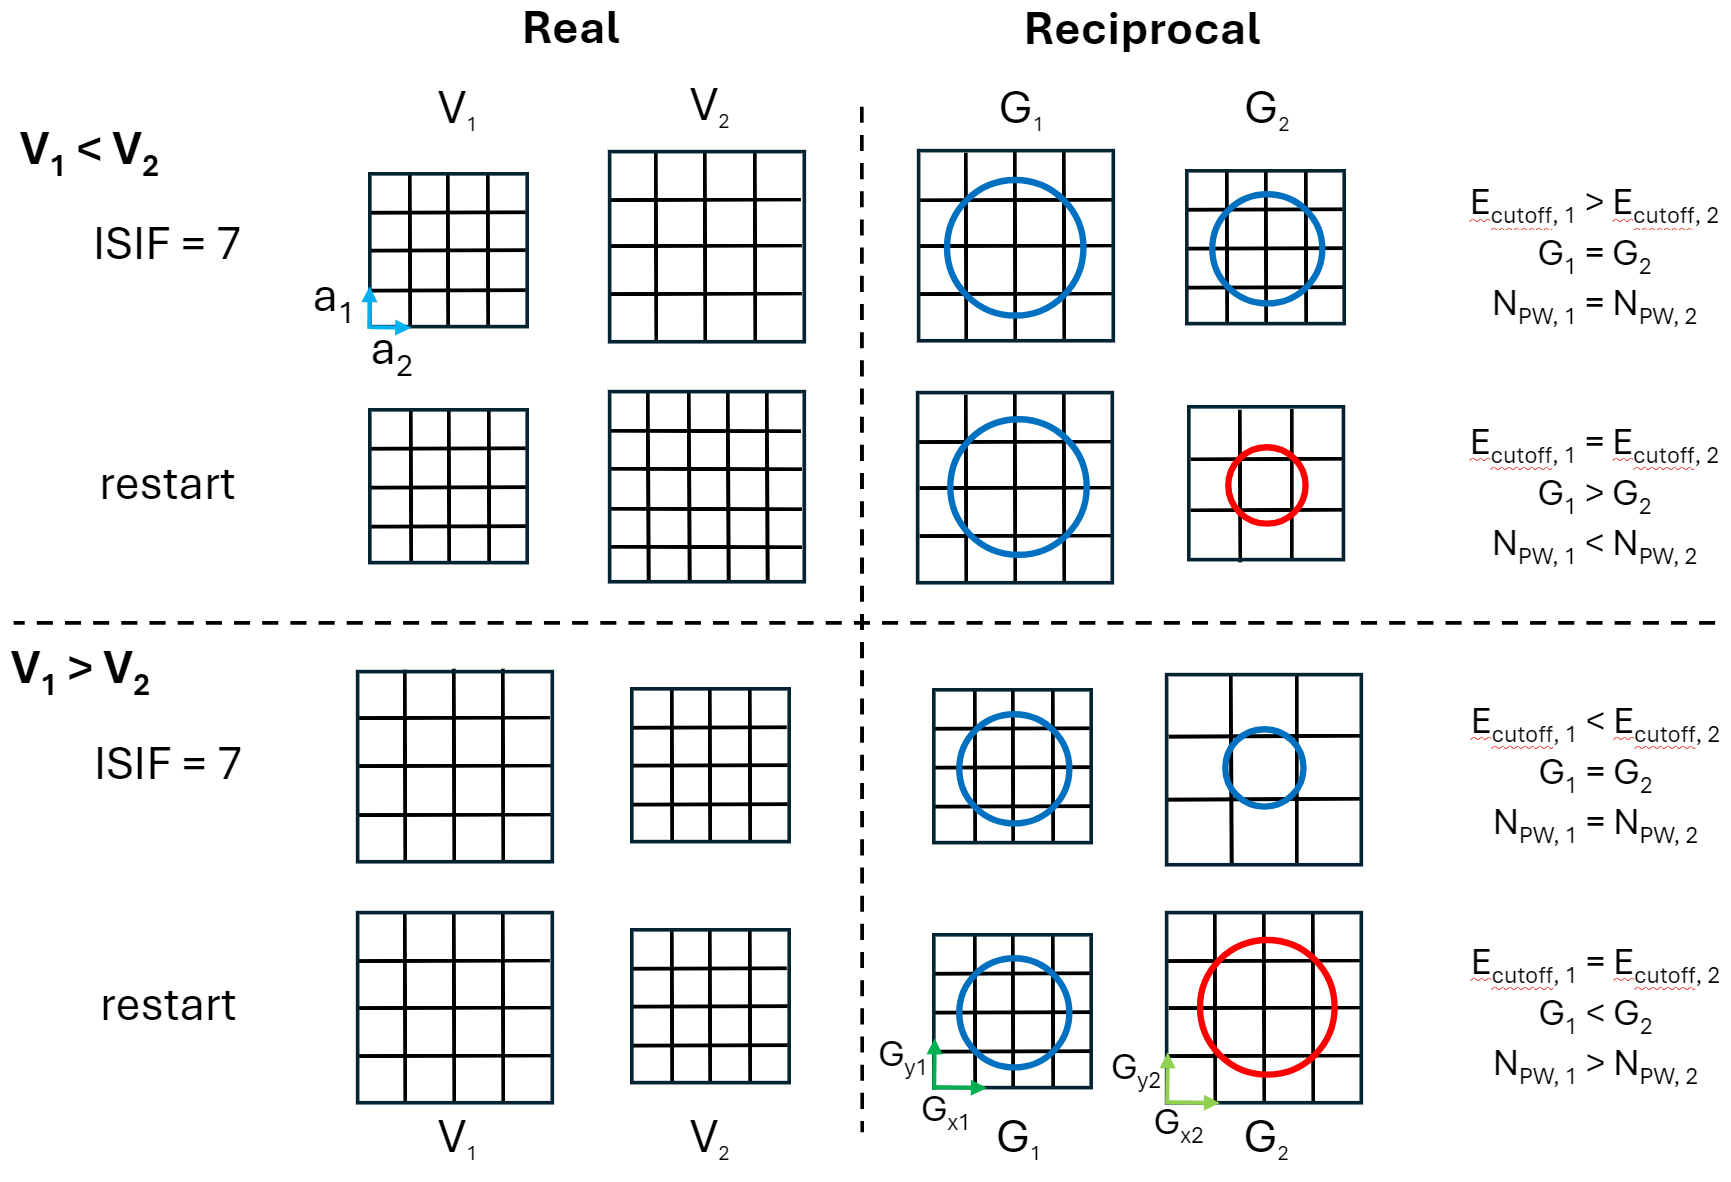
| 12:20, 31 July 2024 | Pulay stress grids.png (file) |  |
177 KB | Csheldon | 4 | |
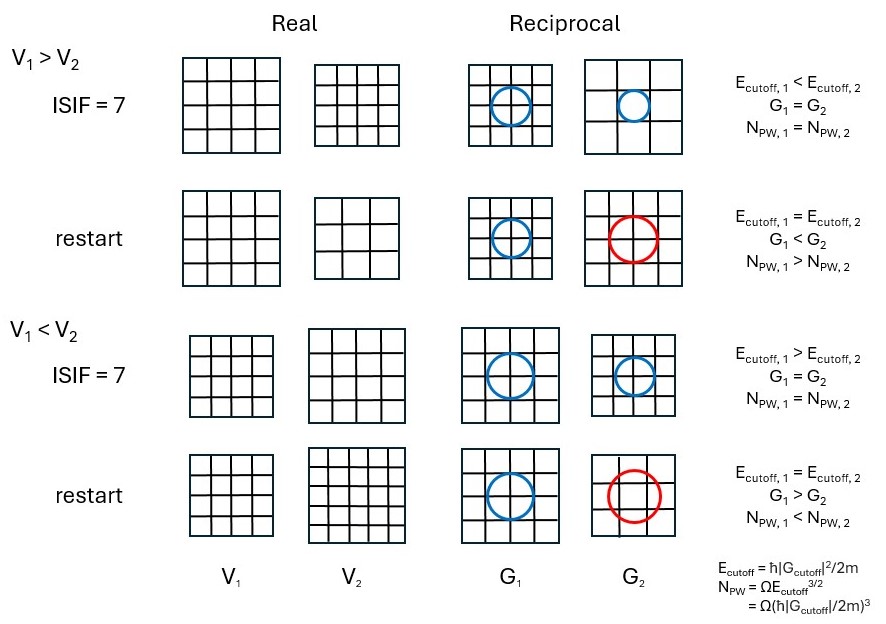
| 15:56, 25 July 2024 | Pulay Stress Grids.jpg (file) |  |
92 KB | Csheldon | Illustration of volume change on grids, plane wave cutoff, and number of plane waves. | 1 |
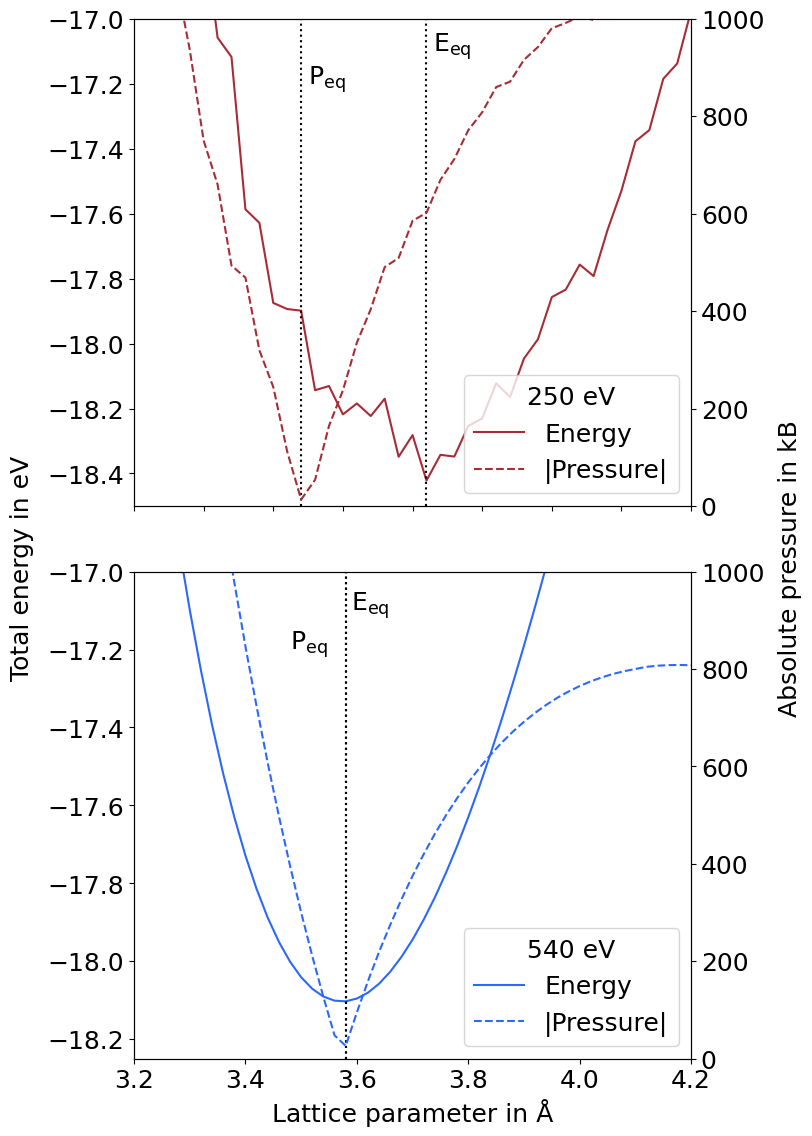
| 09:55, 18 July 2024 | Pressure energy volume.png (file) |  |
134 KB | Csheldon | 3 | |
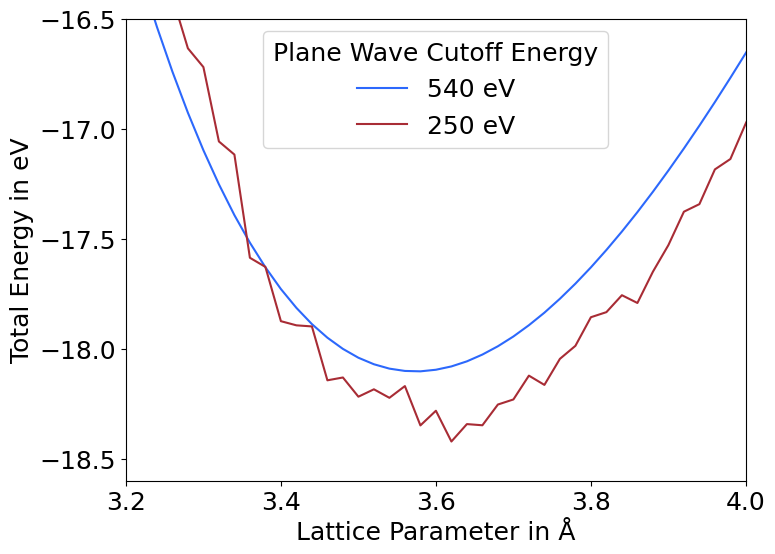
| 09:52, 18 July 2024 | ENCUT comp.png (file) |  |
59 KB | Csheldon | 7 | |
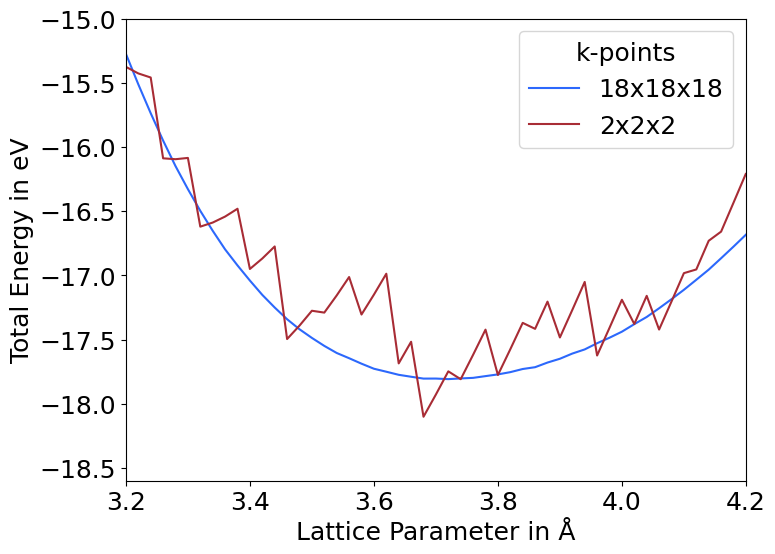
| 09:52, 18 July 2024 | Kpoint comp.png (file) |  |
60 KB | Csheldon | 8 | |
| 11:38, 12 July 2024 | Sloshing1.png (file) |  |
335 KB | Vaspmaster | 1 | |
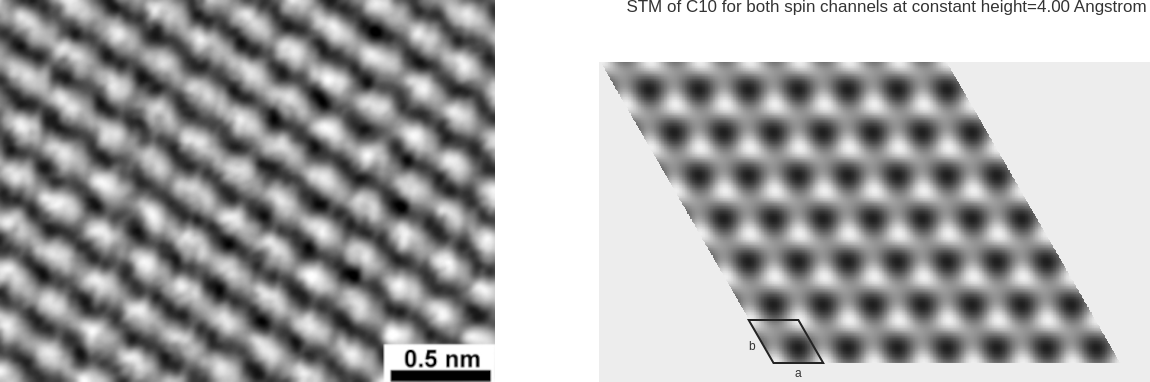
| 13:54, 13 June 2024 | STM Graphite exp sim.png (file) |  |
129 KB | Wolloch | A combination of an experimental (left) STM image of Graphene, and a simulated one (using py4vasp). The experimental image was measured at ambient conditions (at room temperature, and in air), at the Department for Earth and Environmental Sciences, LMU, and Center for NanoScience (CeNS), Munich. The picture is in the public domain and was taken from Wiki Commons: https://commons.wikimedia.org/wiki/File:Graphite_ambient_STM.jpg The simulated image was produced by Michael Wolloch on June 13th... | 1 |
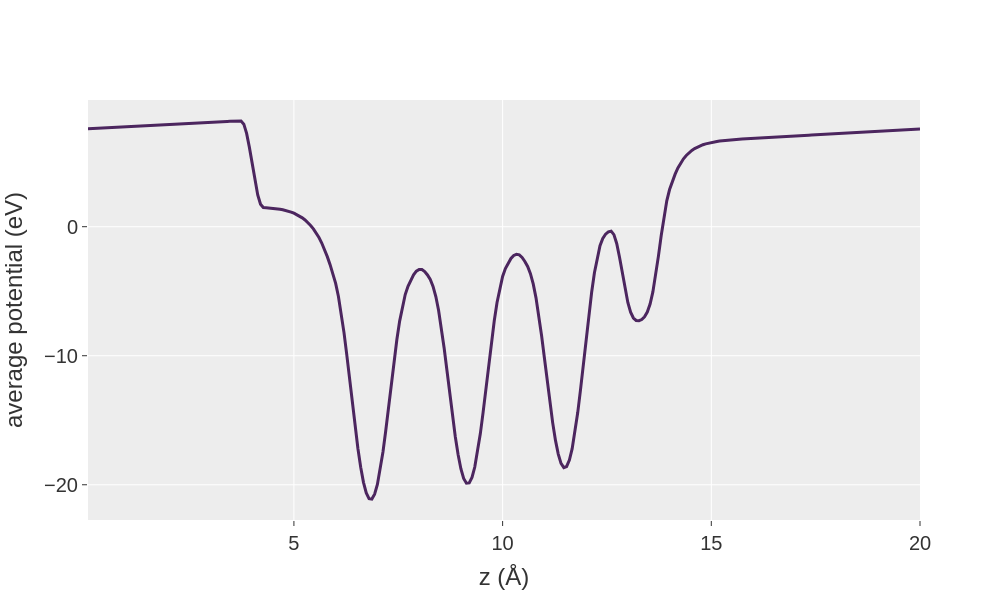
| 13:16, 13 June 2024 | Work function.png (file) |  |
63 KB | Schlipf | Average potential perpendicular to the surface of the system | 1 |
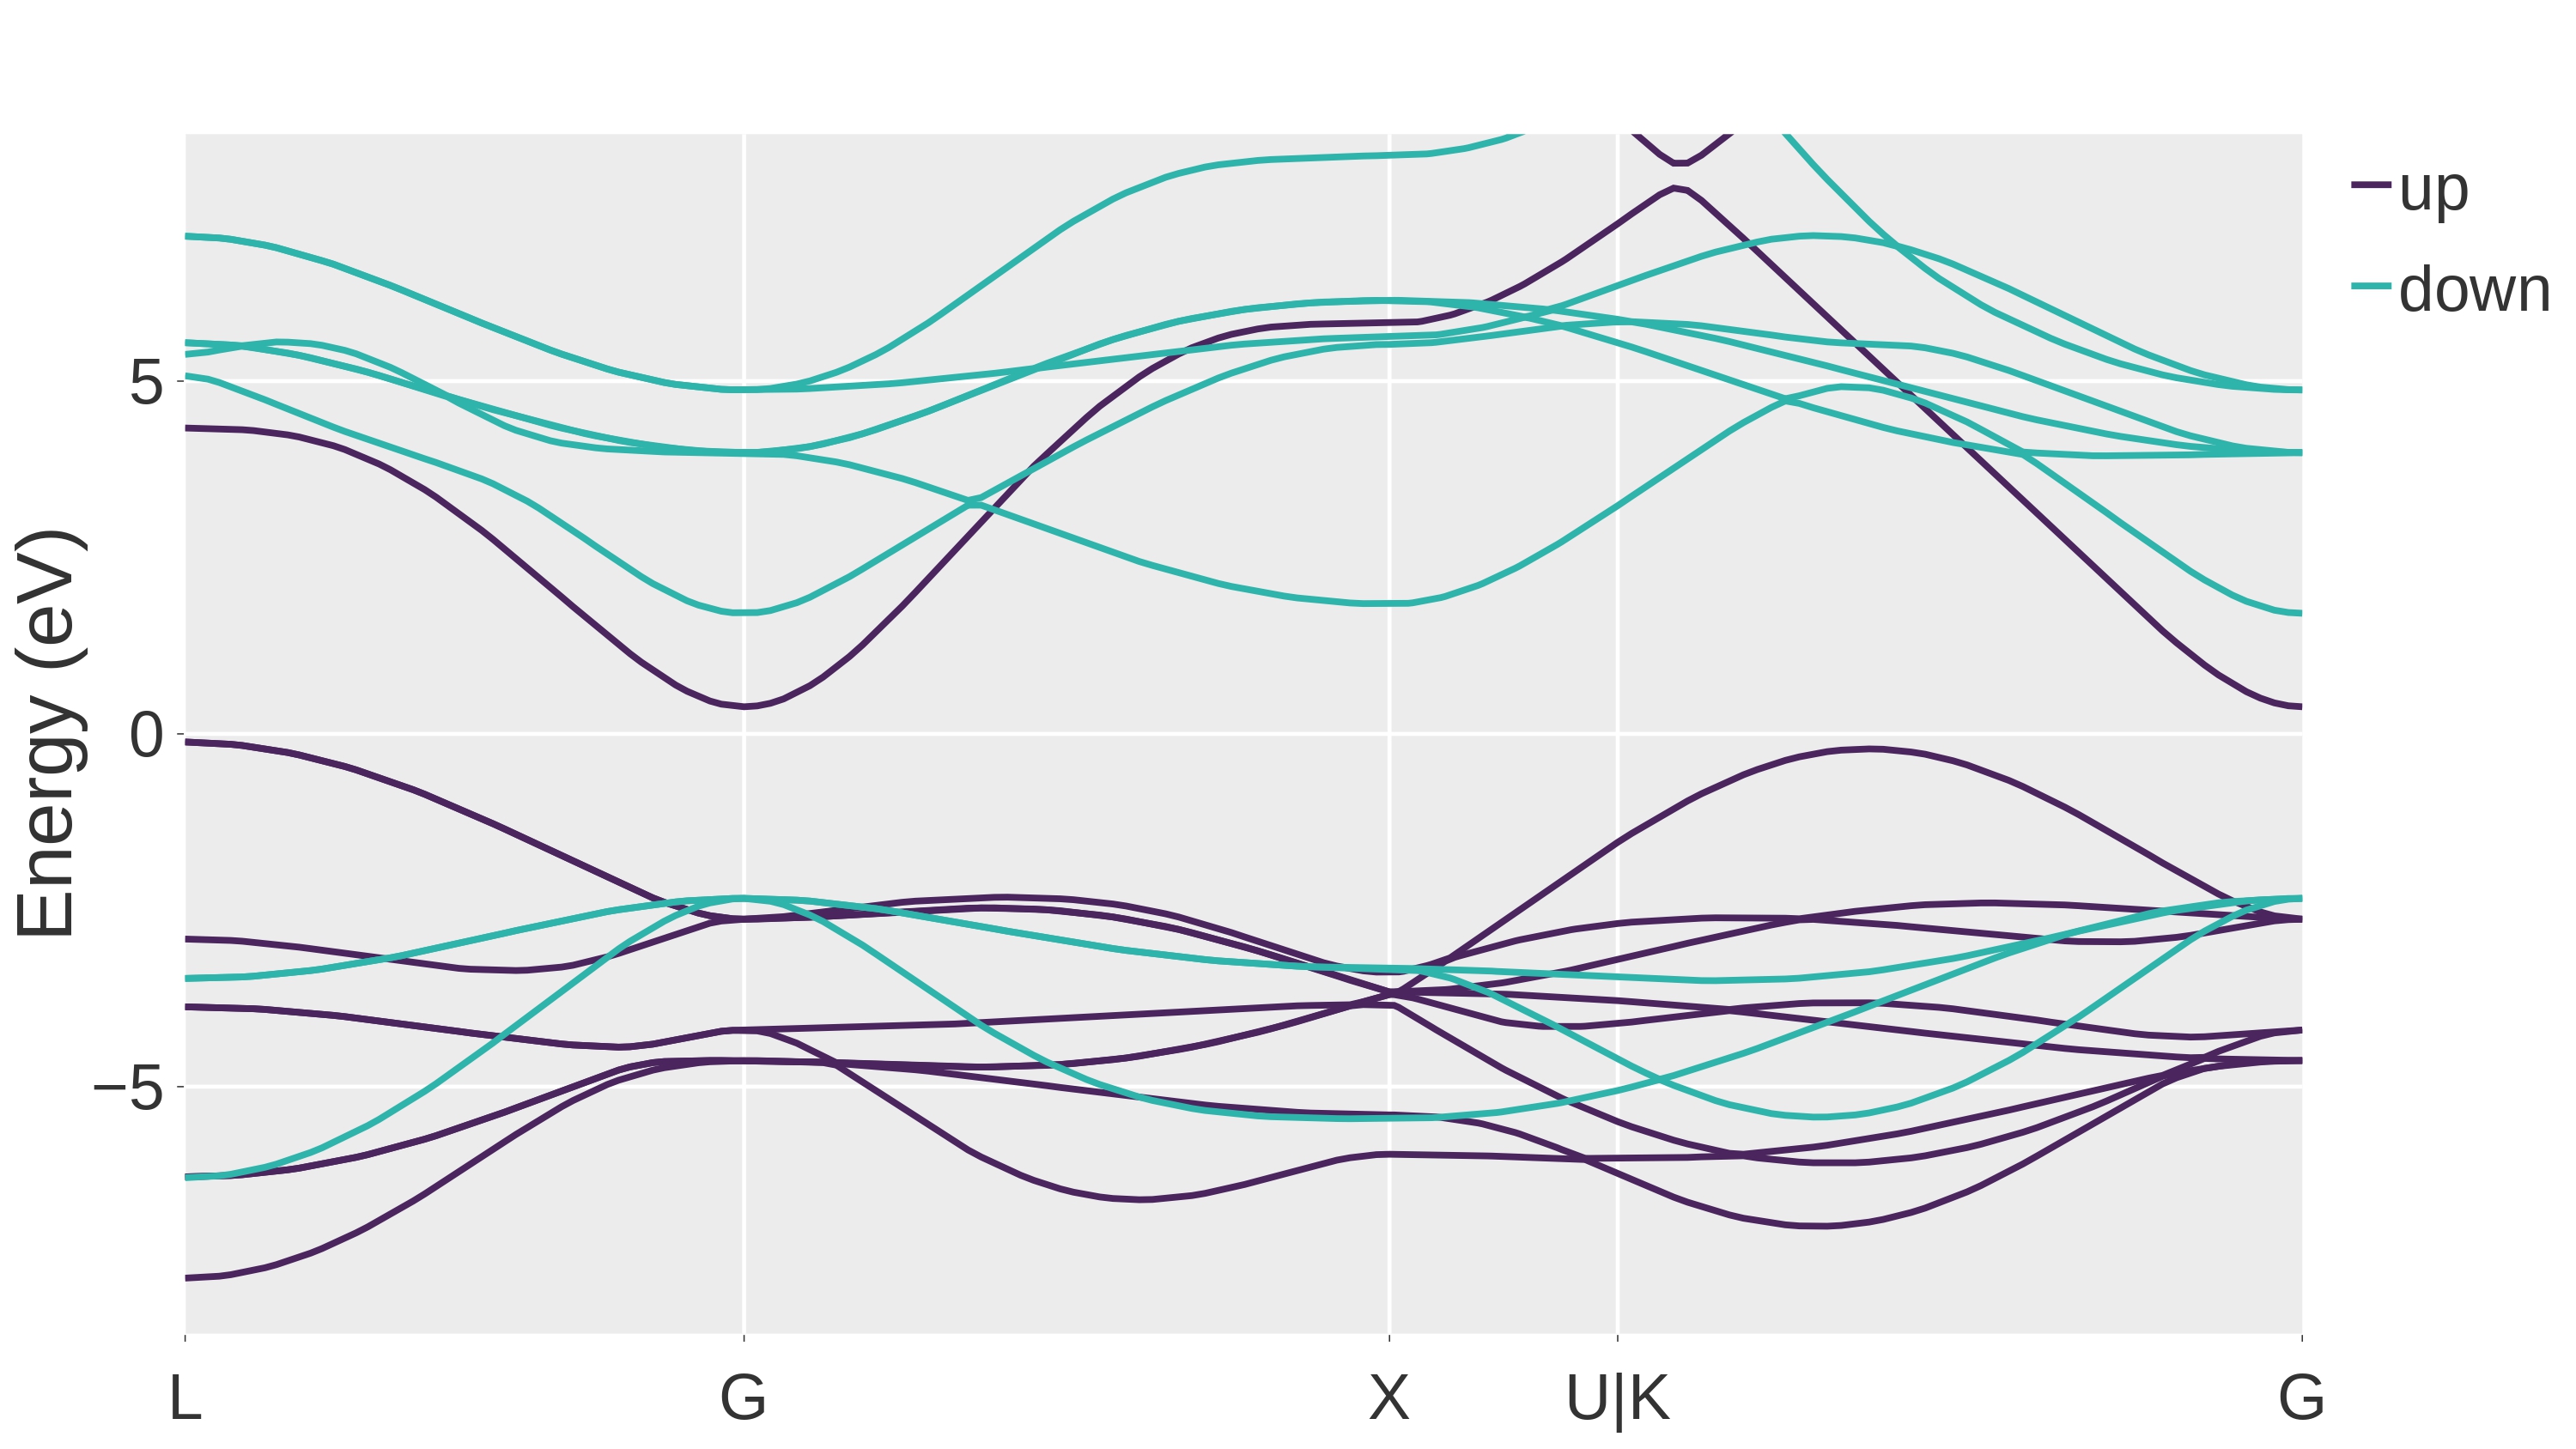
| 10:35, 13 June 2024 | Band.jpg (file) |  |
817 KB | Schlipf | Band structure plot of energy eigenvalues of orbitals | 1 |
| 08:56, 13 June 2024 | CRPA of SrVO3.zip (file) | 262 KB | Kaltakm | Update CRPA tutorial of SrVO3 for vasp-6.4.3 and newer. | 1 | |
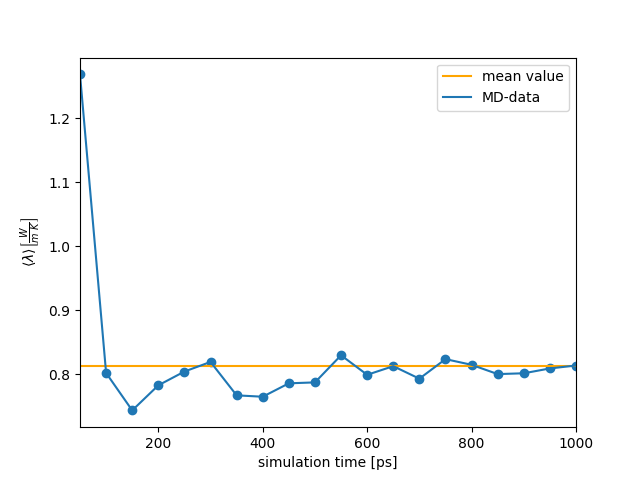
| 12:59, 12 June 2024 | FMP method convergence.png (file) |  |
23 KB | Jona | The graphic shows the convergence of lambda with progressing simulation time. Improvement of the first uploaded graphic | 1 |
| 10:50, 12 June 2024 | SrVO3 GW band.zip (file) | 530 KB | Kaltakm | fix currupted file | 2 |